
Do “happier” countries have lower levels of
depression and anxiety – A study to explore the
association between the World Happiness
Index and the prevalence of depression and
anxiety disorders by Country.
TOTAL WORD COUNT:
6,000 (EXCLUDING REFERENCES, APPENDIX AND FIGURES)
DONG ZHENG
Acknowledgements
I am grateful for the help I have received during writing of this essay. Word
cannot express my gratitude to Dr Charlotte O’Brien, who have guided me
through this process and provided valuable support at every stage.
My dear friends, Dr Xi mian Quan and Dr Mohammed Zeina played pivotal roles
in the formulation of my final essay. I could not have done this without their
inputs in reviewing many drafts of my review essay and the late-night feedbacks.
Their encouragements and emotional support throughout this journey have
carried me to the final stages.
I would also like to thank my close friend Mr HuiKai Shi, who let me bounce off
many ideas during the initial stages of the essay. As well as providing feedbacks
on the early drafts of this review essay.
Abstract:
Introduction: It is a common preconception that countries with higher levels of
“happiness” would have lower levels of mental diseases. This essay interprets
happiness as subjective wellbeing and explores its association with depression and
anxiety disorders.
Aims: Investigate the relationship between the world happiness index and the
prevalence of depression and anxiety
Method: Statistical analysis are employed in this review. Scatter graphs were plotted
for the WHI and its six explanatory factors against depression and anxiety prevalence
to investigate the correlation. Subsequent Pearson’s correlation coefficient is calculated
using STATA.
Findings: No linear correlation is observed between the WHI and the prevalence of
depression and anxiety. A positive correlation was shown between the explanatory
factors GDP per capita, social support and healthy life expectancy at birth with anxiety
and depression prevalence. However, due to the nature of mental health and its
diagnosis criterias, the current epidemiological data for mental disease do not reflect
the actual global mental health burden.
Conclusion: The essay found some overlaps between subjective well-being and its
constituents with the prevalence of depression and anxiety disorders. Yet, other
determinants also has a strong influence on the development of anxiety and depression.

Introduction:
Ever since human existence, attempts have been made to define, explore, and attain
happiness. Research on the linguistic and historical roots of happiness suggests that the
concept has gradually evolved from the meaning of luck and fortune in ancient China,
to its contemporary usage in the English language to describe one’s inner positive
feelings,[1] often conceptualised as affective wellbeing – the fulfilment of pleasure and
avoidance of misery.
In the healthcare context, happiness is used interchangeably with subjective wellbeing.
[2] The literature agrees on the necessity of experiencing positive emotions in achieving
happiness but also mentions the essence of perceiving one’s life as meaningful and
worthwhile,[3] this can be conceptualised as eudemonic wellbeing- pursuance of
purpose and meaning in life. Moreover, Greek philosophy, Christianity, and Buddhism
emphasise the importance of self-development, mindfulness, and mental health rather
than objective social or economic circumstances of the individual in achieving
happiness. Both affective and subjective well-being are interlinked with life satisfaction
experienced in daily life. Since 2012, an annual publication called The World Happiness
Report (WHR) has attempted to quantify the concept of happiness by ranking life
evaluations by country. Its aims are to understand and measure global wellbeing and
encourage governments across the globe to centre sustainable development goals
around “happiness”. The report discusses a two-way interaction that links happiness
with personal factors, and mental and physical health. [4]
Intuitively, one would assume that the concept of happiness is not compatible with
depression and anxiety disorders, as these diseases are characterised by prolonged low
mood, feelings of guilt, reduced self-esteem, and irritability, while happiness is more
commonly associated with joy, contentment, and satisfaction. Therefore, a natural
conjecture is presumed that societies with high levels of happiness would have a low
occurrence of affective mental disorders. Numerous studies have shown that people
who experience happiness tend to be less prone to mental illnesses, whlist breeding
success across multiple life domains, including health, income, friendships, and
marriage. [5]
The ambivalence between happiness and depression also captured the attention of the
media. In 2019 BBC Worklife published the news article titled: “being depressed in the
“world’s happiest country,” reporting the mental health challenges in Finland, [6] the
nation that topped the world happiness index in 2019. However, there is minimal
academic research linking the association between happiness and mental health.
Despite the presence of ICD-10 and DSM-5 standard diagnostic criteria, there lacks a
guideline that accounts for biopsychosocial differences. These diagnostic criteria and
supplementary questionaires are mostly subjective unidimensional measures. Mental

disorders, more than any other branches of medicine, are closely intertwined with social
determinants of health, and their diagnosis can have a heavy reliance on cultural
influences. Social determinants including inequalities in income and education can
influence one susceptibility to mental illnesses through epigenetic interactions with
their environment.[7] The mission to fully understand and tackle mental illness remains
an urgent global health priority.
Background:
World Happiness Report – W hat is it
Similar to medical literature [2], the World Happiness Report (WHR) uses subjective
well-being in relation to the concept of happiness. The WHR measure of subjective
well-being are based on life evaluations, which is defined as “a reflective assessment
of a person’s life or some aspects of it.”[8] The life evaluation measure is based on the
Gallup world poll surveys, which select 500-3000 individual responses annually from
each country across the globe to provide a representative sample. The respondents are
asked to evaluate their life positions using the Cantril ladder scale, which ranks the best
possible life as 10 and the worst as 0. A population-representative average is then
generated for each country. The ranking uses data average of the the 3 years prior to the
year it is evaluating. The reason behind this is that not every country is surveyed
annually, and increased sample size would give more precise estimates. [9] Thus, the
world happiness index is effectively a ranking of average life evaluation scores by
country.
World Happiness report – explanatory factors
The WHR uses six key comparable national variables to explain the difference in
average life evaluation for the countries included in the ranking.These are continuous
numerical values to illustrate the likely two-way correlations between the variables and
life evaluations. The six variables are the perception of corruption, generosity, freedom
to make life choices, healthy life expectancy at birth, social support, and GDP per capita.
The final seventh variable, Dystopia- a hypothetical country with the world’s lowest
value (1.83) for the six variables is included to allow a positive calculated contribution
for every actual country. [9] Dystopia is used as a benchmark for comparison among
different countries to provide an explanation for the rankings of the average life
evaluation in the annual world happiness report.
The six factors used to explain the average life evaluation rankings are chosen to
reflect a component of happiness. Intriguingly, they have a degree of overlap with the
determinants of depression and anxiety disorders. For example, social support can offer
both direct protection through positive social relationships and indirectly acting as a
buffer against stressful events. In children and young adults, positive family support
appeared to be the most protective factor against depression.[10] Youths need to rely
on their parents to sustain their basic needs, including both emotional support and
material resources. In addition, family support can enhance self-esteem in young adults
and decrease negative self-evaluation and the subsequent depressive symptoms. [11] In
adults, spousal support is the strongest protective factor against depressive symptoms.
Both giving and receiving support from spouses are related to increased positive mood,
less anxiety, and depression. [12]
Freedom to make life choices correlates closely with mental health symptoms.
Cognitive impairment, referring to deficits in problem-solving, short-term and working
memory, and visual and auditory processing is a defining feature of major depression,
[13] which affects short-term and long-term decision making, restricting the patient
from their free will. Furthermore, in forensic psychiatry, free will is an essential
requirement for moral responsibility, and that free will can be compromised by mental
disorders.[14]
Generosity can influence the maintenance of positive emotions, stress reduction and
enhances one’s sense of purpose. Generosity is the act of altruism, a form of positive
social connection and empathy. The 2015 WHR involved neuroimaging studies that
have shown activation of the ventral tegmental area and ventral and dorsal striatum
when individuals donate and receive money. The ventral tegmental area is associated
with reward and motivation, while the ventral striatum plays a key role in emotion and
learning. Surprisingly, these areas are more active when people donated money than
when they received it. [15] These findings rehearse philosophical ideas of eudemonic
wellbeing, which emphasise the importance of self-development and living a
meaningful life.
GDP per capita is a good measure of the country’s wealth and average individual
income, but it may not provide valid insight into the distribution of wealth in society.
Countries with a high income per capita tends to have a well-developed welfare system,
which includes a good education system, and a universal healthcare system. These
factors are strong influences on the development and progression of depression and
anxiety disorders. Research has identified how social-economic variation can create a
treatment gap for mental diseases. Analysis showed around 75% of the population in
middle and low-income countries have not received any forms of treatment for their
depression, because of a lack of trained staff and resources, and the social stigma
associated with the illness. [16] This was supported by WHO estimates in 2019 which
also found that 80% of patients suffering from mental health disorders are not able to
afford treatment or receive psychiatric help because the country does not have universal
healthcare. [17]

Life expectancy at birth can also be reflective of a country’s healthcare developments
and population living conditions. More importantly, depression and anxiety disorders
are one of the leading causes of the global disease burden, accounting for 7% of total
global DALY (disability-adjusted life years) and 19% of disabilities lived
worldwide.[18] One retrospective using US mortality data demonstrated that people
with depression/anxiety died on an average of 7.9 years earlier than their non-diseased
counterparts.[19] These findings provide strong evidence that mental health can affect
one’s overall quality of life and give rise to health complications, which subsequently
influence their life expectancy.
Corruption may seem unrelated to depression and anxiety at first glance, but discretely
it is related to the other variables discussed and can indirectly affect social determinants
of mental illness. For example, the main form of corruption is direct financial bribery.
The loss of income and the arbitrariness nature of bribery can create anxiety and other
negative emotions in the briber. Also, in some countries, violence or harassment used
to popularise the bribery culture aggravates feelings of helplessness and erodes the
accountability of the governing structures and essential services, including healthcare,
social services, and education. [20] The corruption of government officials means less
economic input for public structures. Consequently, fewer resources and medical
training are provided, causing mentally ill patients not being offered treatments or not
treated promptly. Furthermore, the loss of income may render one’s labour meaningless.
The feeling of despair coupled with an inability to provide for one’s family can induce
pessimistic thoughts, leading to vicious cycle breeding symptoms of depression and
anxiety disorders. This phenomenon is described by economists as the “depression
poverty trap.”
World Happiness Report – Reports on mental health
Since its first publication in 2012, mental health has been a recurrent theme in world
happiness reports. For example, the 2012 WHR has attempted to address the question
of how important mental health is in explaining the variation of happiness within any
particular country. The reports suggest that the indirect effects of mental health also
have a significant effect on later life. For example, adolescents who have experienced
depression are more likely to experience unemployment, teenage pregnancy, criminal
records, poor physical health, low income, and worse educational performance. All of
these consequences have a direct effect on happiness, both on the individual and the
community. [4] The 2013 WHR dedicates a specific chapter to mental health and
unhappiness. The report showed mental health to be the biggest and the single most
important determinant of happiness for individuals but are mostly ignored by
policymakers. [21] It argues that mental illnesses such as depression and anxiety not
only restrict individual fulfilment in life but also cause difficulties in communication

and the formation of relationships, resulting in social isolation. In addition, severe
mental illness can affect one' s mental capacity, robbing individuals of their natural
thoughts, feelings, and behaviours. In addition, the report indicates that mental health
problems are the most important explanatory variable, exceeding the impacts of
physical health problems, income, and unemployment. The report concludes that
mental health is closely tied with global happiness in two ways. “Better treatment for
mental health would improve happiness directly, and improving happiness in other
ways would reduce the frequency of mental illness.” [21]
The discussion around mental health continued in 2018 and 2019 WHR, where the
Easterlin paradox drew attention. The Easterlin paradox describes the phenomenon in
USA where the income per capita in has doubled since 1972, but subjective wellbeing
remains roughly unchanged or declined. The report proposes a causal relationship
between non-income-related social determinants and increased levels of obesity,
substance abuse disorders, and major depressive disorders.[22] More strikingly, these
factors are most likely to be interlinked. Obesity was found to increase the risk of
depression, most prominently patients with clinically diagnosed depression. [23] One
of the many implications of addictive behaviours is the development and worsening of
mood and anxiety disorders. Substance abuse can lead to mood dysregulation and
secondary acute stress events, giving rise to clinical depression. Conversely, mood
disorders can also provoke addictive behaviours as depression patients attempt to “self-
medicate” out of their dysphoria and resort to medication abuse. [24]
The 2022 report examined people’s emotional experiences and wellbeing through
analysing text communications on social media. As emotions are not mere internal
feelings, but also social in nature. Therefore, positive and negative emotions can be
spread through social media, influencing other people’s emotions. [25, 26] The findings
revealed there was a large upsurge of anxiety-related terms on Twitter in all countries
shortly before and with the onset of lockdowns. In addition, the rise in anxiety was more
significant in countries with greater number COVID-19 cases. In comparison, the
phrases on social media expressing anger decreased and sadness increased two weeks
later. [9]
Study Design
Statstical analysis
The study is facilitated using the statistical analysis functions on STATA (17.0) software
[27], where scatter plots and pearson coefficients are used to analysis the raw data. The
process is summarised by the algorithm in figure 1.

The Pearson’s coefficient (r) is used in the statistical analysis to measure of the strength
of the linear association between the two variables. The first part of the analysis
involves examining the relationship between the average life evaluation from 2017
WHR and the WHO estimates of the prevalence of anxiety and depression. The
Pearson’s correlation coefficient is determined at the 95% significance level with the
dependent variable being the 2017 world happiness index, and the independent variable
being the prevalence of depression and anxiety respectively. The null and alternative
hypothesis for this analysis is stated below:
H0: There is no correlation (r=0 or no pattern on scatter graph) between average life
evaluations and depression and anxiety prevalence.
H1: There is a correlation (r≠ 0 or pattern identified scatter graph) between average
life evaluations and depression and anxiety prevalence.
The second and third part of the statistical analysis aims to determine the correlation
between the six explanatory factors and the prevalence of depression and anxiety. In
these two parts of the statistical measurements, the significance level of 95% is used
with the dependent variables being anxiety and depression prevalence respectively and
the independent variable being the explanatory factors for the 2017 WHI rankings. The
null and alternative hypothesis for the second and third regression analysis is stated
below:
The null hypothesis for the second part of the statistical analysis:
H0: There is no correlation (r=0) between the explanatory factors for the 2017 WHI
and depression prevalence.
H1: There is a correlation (r≠ 0) between the explanatory factors for the 2017 WHI
and depression prevalence.
The null hypothesis for the third part of the statistical analysis:
H0: There is no correlation (r=0) between the explanatory factors for the 2017 WHI
and anxiety prevalence.
H1: There is a correlation (r≠ 0) between the explanatory factors for the 2017 WHI
and anxiety prevalence.

Figure 1 Flowchart showing the algorithm for the statistical analysis procedure
Data collection
The data variables for the statistical analysis are based on the 2017 World Happiness
Report [8] and WHO global health estimates of depression and other common mental
health disorders published in 2017. [28] The WHO estimates are the most up-to-date,
global epidemiological estimations by country on depression and anxiety disorders. [29]
The WHO estimations are synthesised from the Global Burden Disease study [30] to
provide a country-specific estimation of depression and anxiety prevalence for the year

2015. Similarly, the 2017 WHI is produced from an average of 2014-2016 Cantril
ladder scores. The average life evaluation values and the explanatory factors are taken
from chapter 2, online data in the appendix of the 2017 World Happiness Report. [8]
The WHO 2017 global mental health estimates report did not include Taiwan, Hong
Kong, Kosovo, North Cyprus, and Palestine Territories. [28] To minimise the statistical
bias of introducing new datasets from other estimates and literature, these countries are
excluded from the analysis.
Study design limitations
The most significant limitation for ecological studies is ecological fallacy. Therefore,
the findings from this study on the relationship between happiness prevalence levels of
depression and anxiety may not apply at individual levels. In addition, this is an
observational study, which makes it difficult to draw causational conclusions, Maybe
there are relationships between the investigated variables, but they are complex and non
linear.
Results
Quantitative analysis
Examining the scatter plots, no visible linear relationship can be observed between the
World Happiness Index scores and the prevalence of depression and anxiety. Neither of
the two scatter plots demonstrates a strong positive or negative correlation between the
variables.
From the scatter plot, we can observe the majority of the countries have a WHI score
between 3-7 and an anxiety prevalence of 2-6% of the population. There are several
outliers for the scatter plot comparing anxiety prevalence and WHI, which defies the
applicability of Pearson’s correlation coefficient, as the outliers would distort the
measure of linearity between the variables. The data plots were more spread out for the
depression prevalence, where most of the countries measured had a depression
prevalence of 3-6% of the total population. No linear relationship can be identified
between the independent and dependent variables, so it does not satisfy the criteria for

determining Pearson’s correlation coefficient. No alternative patterns (e.g., quadratic
curvature) can be observed from the scatter plots in figure 2. Therefore, we would
accept the null hypothesis based on the scatter plot, where no correlation between the
world happiness index and the prevalence of depression and anxiety can be observed.
We conclude that no correlation between the world happiness index and the prevalence
of depression and anxiety can be observed.
F
igure 2
Scatter plot showing the association between world happiness index
and depression/anxiety prevalence
For the scatter plots in figure 3, the independent variables plotted on the X axis are the
explanatory factors for the WHI, and the dependent variable plotted on the Y axis is the
depression prevalence estimates. The scatter plots failed to show an observable
correlation between perception of corruption, freedom of choice, generosity, and the
independent variable of depression prevalence. A moderate positive correlation can be
identified for the GDP per capita and healthy life expectancy at birth, which has a
Pearson’s correlation coefficient of 0.579 (p=0.00 r
2
= 0.335) and 0.553 (p=0.00
r
2
=0.306) respectively (see appendix). The GDP per capita can explain 33.5% of the
variation in depression prevalence, while healthy life expectancy at birth can explain
30.6% of the variation in depression prevalence. In comparison, social support only had
a weak correlation of 0.411 (p=0.00 r
2
=0.169) with the prevalence of depression, which
explains 16.9% of the independent variable. These findings imply that with the increase
in GDP per capita, healthy life expectancy, and social support, there is a rise in
depression prevalence. The null hypothesis is rejected and the alternative hypothesis
is accepted at the 95% significance level, which suggests there is a correlation between
the dependent variables comprising social support, GDP per capita, life expectancy, and
the independent variable of depression prevalence.
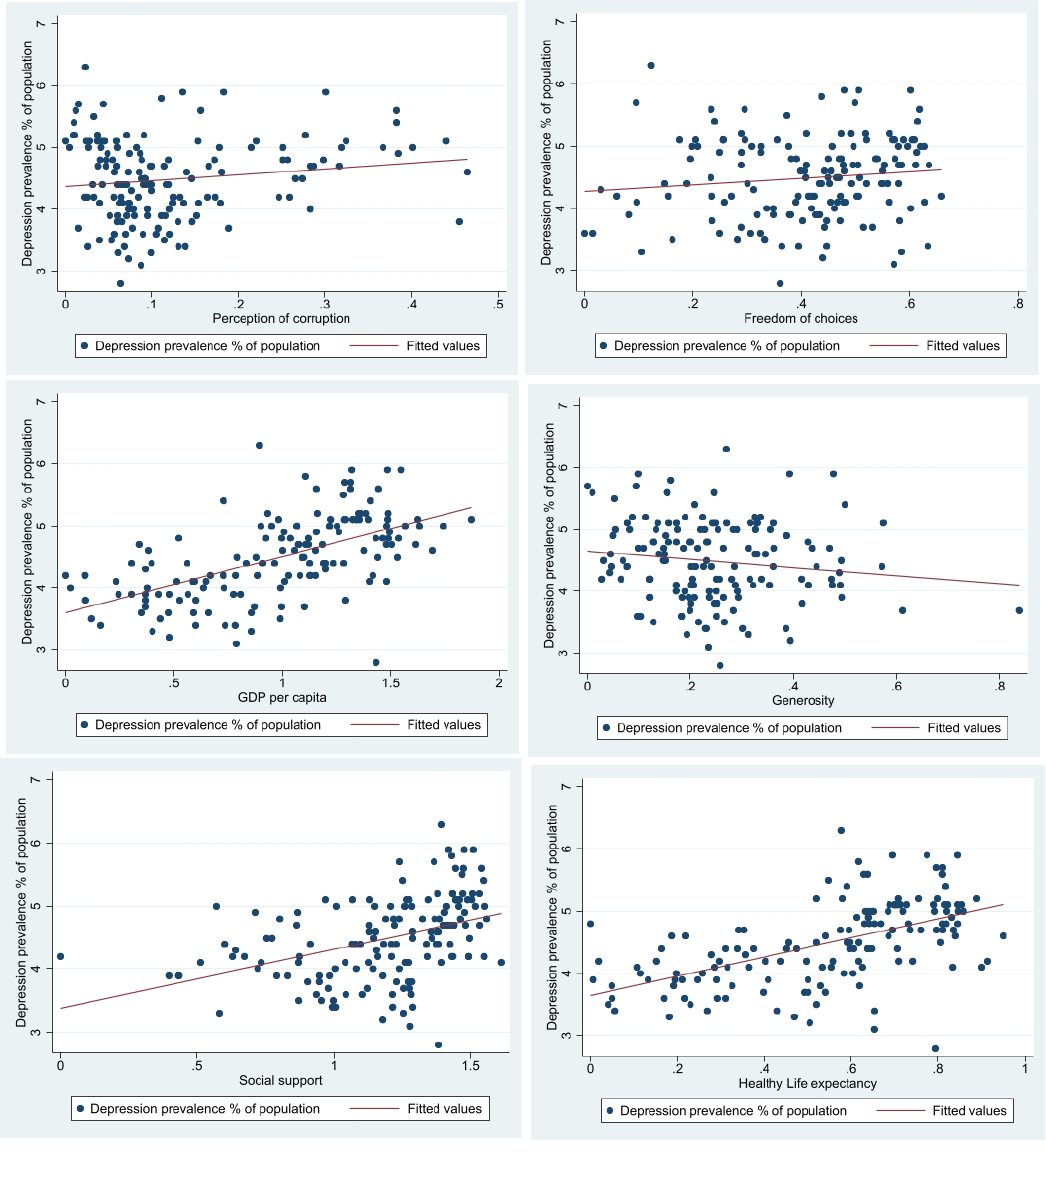
Figure 3 Scatter plots showing the association between the explanatory factors of WHI and depression prevalence
Figure 4 plots anxiety prevalence as the dependent variable and the explanatory factors
for happiness as the independent variable. There is no observable correlation between
perception of corruption, freedom of choices, generosity, and the independent variable
of the prevalence of anxiety. There is a weak positive correlation between social support
and anxiety prevalence with an r-value of 0.366 (p=0.00 r
2
= 0.134), which explains
13.4% of the variation in anxiety prevalence in different countries. A moderate
correlation is identified for the dependent variables of healthy life expectancy at birth
and GDP per capita and the independent variable, which has a correlation coefficient
value of 0.539(p=0.00 r
2
= 0.291) and 0.507(p=0.00 r
2
=0.257) respectively (see
appendix). These statistical findings imply that healthy life expectancy explains 29.1%
of the variation in anxiety prevalence, while GDP per capita can explain 25.7% of the
variation in the independent variable. In summary, the scatter plots and the correlation
coefficient suggest surprisingly, that with the increase in social support, healthy life
expectancy at birth, and GDP per capita, there is an increase in anxiety prevalence in
the population. Therefore, we can reject the null hypothesis and accept the alternative
hypothesis at the 95% significance level.
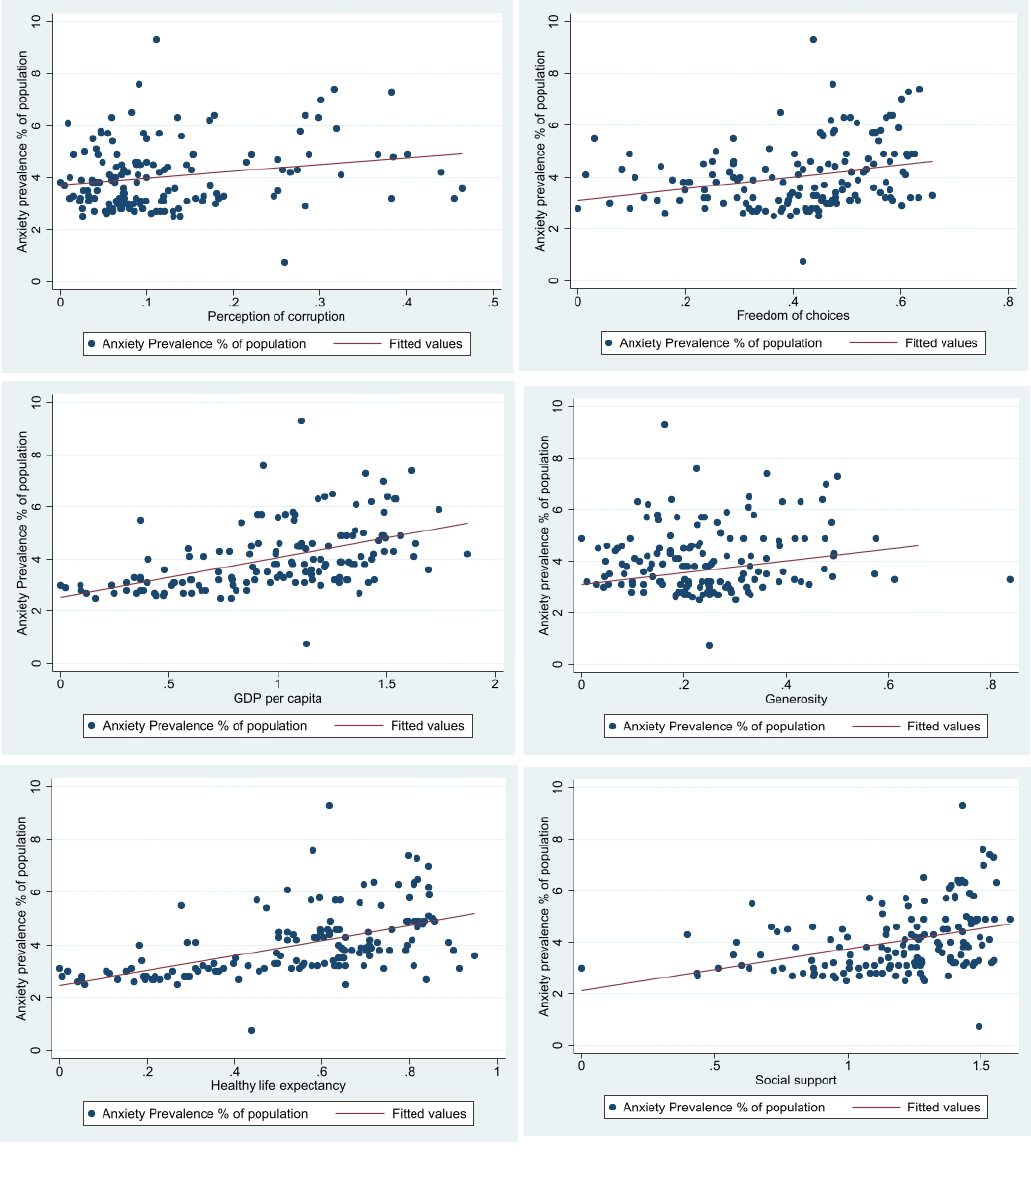
Figure
4 Scatter plots showing the association between the explanatory factors for happiness and anxiety prevalence

Discussion
GDP, life expectancy, social support, and mental health
The result from the analysis implies countries with higher GDP per capita, healthy life
expectancy at birth, and high levels of social support have a higher prevalence of
depression and anxiety disorders in the population. These findings paradoxically
suggest that high income, longer life expectancy, and good levels of social support can
become risk factors for the development of depression and anxiety.
Contrary to the statistical findings, popular preconceptions and research studies
acknowledged that wealth and high income are protective against depressive disorders.
A multivariate logistic regression study based on the national survey in the US showed
higher predicted probabilities of depressive symptoms for low family saving groups
compared to high family saving groups at every income level. Even after controlling
for other confounding factors including gender, age, education, marital status, ethnicity,
and family income, a person with low family savings has 1.49 times (OR 1.49 1.01-
2.21 95% CI) higher odds of having depressive symptoms than individuals with high
family savings (above $20,000). A person in a family with an annual income less than
$20,000 is 2.74 more likely to have depression symptoms than a person in families with
an annual income greater than $75,000 (OR 2.74 1.87-4.01 95% CI)[31]. In addition,
accumulating evidence has demonstrated that poverty and mental health conditions are
traveling partners. Negative income shocks, such as job loss and excessive debts can
worsen a person’s mental status through resultant worries and uncertainties. While the
provision of social welfare, insurance, and health can lower depression and anxiety
occurrence. [32] Research where providing free health insurance worth $550-$750 a
year to low-income individuals showed a reduction in depression rate by a quarter
within a few months, this effect cannot be fully explained by a mere improvement in
affordable healthcare. [33]
However, GDP per capita may not reflect accurately one’s income. High GDP per
capita is a crude measure of modernisation, a sociological transformation associated
with greater inequality, more life stresses, malnourishment from over-consumption of
processed foods, and social isolation. For example, China has undergone a rapid social
transformation in the past decades. But social disparities, unemployment, domestic
migrations, and high-intensity overtime work have become common problems. One of
the main costs of becoming the world’s second-largest economy is the mental health of
the younger generations. A retrospective study showed that Chinese individuals born
after 1966 were 22.4 times more likely to suffer from a depressive episode than the
generations born before 1937. This finding was unforeseen, considering those born in
1937’s China would have experienced Japanese invasion, civil warfare, and political
instability. The sudden increase in depressive episodes between the two generations

reflects the mental stresses present in modern societies. [34]
Furthermore, Similar results to my statistical analysis were found in Hidaka’s paper.
A correlation between lifetime risk of mood disorders and GDP per capita showed a
statistical significance (r= 0.464 r
2
= 0.215 p= 0.06) (Figure 5). [35] My results from
assessing the correlation between GDP per capita and depression prevalence (r=0.579
r
2
= 0.335 p=0.00) were supportive of Hidaka’s findings.
In addition, inequality generated from the modernisation process predisposes
individuals to higher levels of social distrust, excessive worrying, and competition, all
risk factors for the development of depression and anxiety. Figure 6 is a scatter graph
plotting lifetime risk for mood disorders against each country’s Gini coefficient. A
strong positive correlation can be observed from the graph (r=0.716) accounting for
51.2% of the results (r
2
= 0.512 p=0.03). [35] Therefore, while high individual income
and wealth appear to be protective of one’s mental health, GDP per capita reflects the
country’s modernisation which unfortunately is accompanied by greater social and
economic inequalities and stresses from modern-day living.
Figure
5 – Scatter graph showing the correlation between lifetime
risk of mood disorder (%)
and GDP per capita ($1k).
(36)
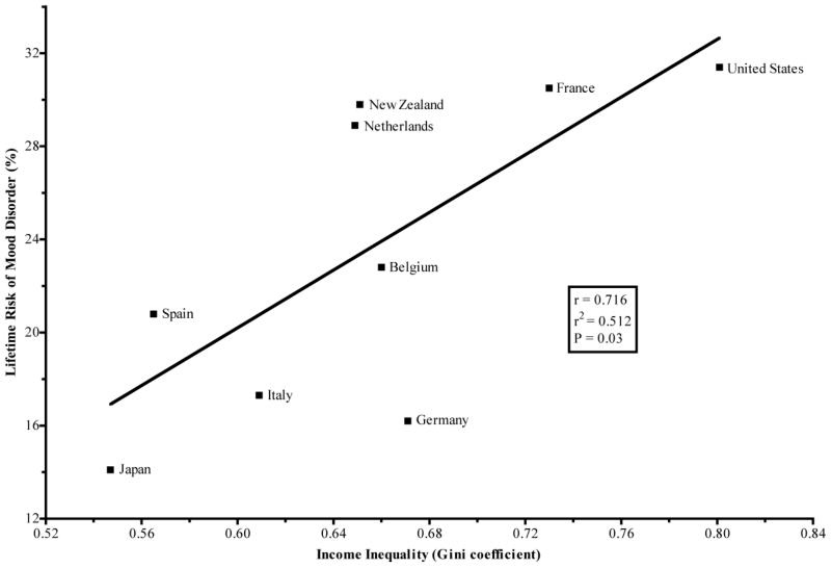
Figure 6 - Scatter graph showing the correlation between lifetime risk of mood disorder (%) and
GDP per capita ($1k) (36)
Interestingly, our results also found a positive correlation between increases in healthy
life expectancy at birth and prevalence levels of depression and anxiety. This was a
strange finding as the mental disease is associated with 7% of DALYs and 19% of YLDs
in 2016,[18] so one should expect an inverse correlation between the two variables.
Research has shown that individuals with mental disorders have an increased risk of
premature mortality. The risk of early death was significantly higher in people of all
ages with a mental disorder. In the Danish population cohort study, it was identified that
males and females suffering from mood affective disorders had a reduced life
expectancy of 7.9 and 6.2 years respectively compared to their healthy counterparts.
Using the Poisson regression models, the mortality rate ratio for mood disorders is 1.92
(95% CI 1.91-1.94), this means that there are 92% more cases of premature deaths due
to mood disorders in the cohort assessed compared to the national population. [36]
One possible explanation for our finding is that anxiety and depression have become
common in old age. Old age is accompanied by various changes in brain structure and
neuropathways, as well as health changes from the aging process such as reduced
mobility and increased loneliness. [37] New onset anxiety disorders, previously thought
to be non-existent in the older population, have now become better recognised by
geriatricians over the past years. A study examining the age at onset in older adults with
GAD, showed a bimodal distribution with 57% of participants reporting an early-onset
(before 50) and 43% reporting a late-onset (after 50). [38] Likewise, in a separate
retrospective study with a mean age of 74.1 years, 46% were late onset and the mean
age of disease diagnosis is 48.8 years. Furthermore, for patients with both diagnosis of
GAD and MDD, typically GAD diagnosis precedes MDD, [39] which is in concordance
with clinical practice as both mental conditions shares some common risk factors and
one can influence the development of the other. Therefore, a plausible explanation for
the positive correlation between life expectancy and depression and anxiety prevalence
could be the increased recognition of late-onset anxiety and depression disorders.
From the results of this study, only a weak positive correlation is identified between
social support and depression and anxiety prevalence. While existing literature suggests
that social support is a protective factor against mental illness through positive social
relationships and indirectly as buffers against social stresses. [10-12, 40-43]
Depression and anxiety-affected individuals can experience cognitive impairments,
which means they may not recognise or even deny that they have a mental disorder. In
communities with a good level of social support, people look out for each other and are
form initimate social relationships, communicating their inner feelings with friends and
families. Therefore, signs of mental diseases are quickly picked up, and timely medical
help sought. Conversely, for individuals who are not supported by their social relations,
their mental health symptoms may not be picked up resulting in underdiagnosis.
Furthermore, social support is integral to health promotion, addressing individuals'
physical and emotional needs, as well as spreading medical information to their social
groups. Poor levels of social support can lead to underdiagnosis and ineffective health
promotions, which inaccurately show low mental health prevalence.
Moreover, unlike GDP per capita and healthy life expectancy, which are objective
measurements. The measurement of social support is calculated from the binary
response to the Gallup World Poll question: “If you were in trouble, do you have
relatives or friends you can count on to help you whenever you need, or not?” The
question is highly subjective and one’s definition of terms such as “trouble,” “friends
you can count on” and “whenever you need” may vary within different cultures and
social circumstances. For example, in Asian cultures people tend to be more reserved
about their opinions and personal feelings, individuals are confronted with their roles
in the social hierarchy. Japanese culture emphasises the concept of “Omoiyari”
(altruistic sensitivity), which promotes empathy and social responsibility in Japanese
society. However, when taken to an extreme, some individuals decide to not “trouble”
others to ensure they will not be “troubled” in the future. [44] Furthermore, in some
parts of the world, society may be based on favouritism, asking for a favour may require
a return in favour in the future, so people may be less inclined to seek help from friends
and relatives. Therefore, the influence of social support on mental health may vary
within different cultures and societies.
Likewise, corruption, generosity, and freedom to make choices are also derived from
binary responses to one or two GWP survey questions.[8] These measures could be
more representative of well-being and have greater relevance to mental health if it is
formulated from a series of well-defined question answered using a numerical scale.

Perhaps this also explains the weak or no correlation in these between subjective
measures and mental health prevalence compared to the moderate correlation seen in
GDP per capita and life expectancy.
Cultural influences on mental health and diagnostic
standardisation
Around 85% of the world’s population lives in middle and low-income countries - [45]
mental diseases accounts for 8.8% and 16.6% of the total burden of disease in middle
and low-income countries respectively. [46] Middle and low-income countries are more
economically vulnerable compared to high-income nations, so their residents are more
likely to be exposed to financial stressors including hunger, job loss, and inability to
cover healthcare fees, which increases their risk of mental health diseases. These factors
may not be fully represented in the WHO estimations for mental health and the WHR.
The diagnosis of depression and anxiety disorders relies heavily on questionnaires and
the clinical experience of the psychiatrist. Although guidance such as ICD-10 and
DSM-5 is widely used, there is no internationally recognised “gold standard” in
diagnosing anxiety and depression. For example, alongside the use of ICD and DSM
criteria, China also uses CCMD-3 (Chinese Classification of Mental Disorders) to reach
a diagnosis. Interestingly, the CCMD-3 also included conditions such as “Qigong
Deviation” (defined as the perception of uncontrolled “Qi” around the body, which also
presents with insomnia symptoms), and mental disorders caused by superstitions
(which can also affect the patient’s cognitive functions). [47] A systematic review
assessing the usage of mental health clinical practice guidelines in Japan showed that
there has been little research into the implementation, barriers, and dissemination of the
guidelines in Japan, [48] suggesting a mixture of mental health guidelines may have
been used.
The problem with questionnaires such as PHQ-9 and GAD-7 is individuals from
different cultural and social backgrounds tend to report their symptoms differently. For
example, because Asian traditions view the body and the mind as unitary rather than
dualistic, Asian patients are more likely to focus on their somatic symptoms and do not
acknowledge emotional symptoms. [49] These findings were also supported by a series
of studies on Hong Kong patients. Although patients were entirely aware of the
emotional difficulties and stresses rooted in social relationships that can result in their
physical and mental symptoms. Most patients selectively present their symptoms and
tend to only target somatic symptoms in healthcare settings. [50, 51] Furthermore,
studies showed that Asian American patients have a lower utilisation rate of mental
health services because they do not approach healthcare services until later stages of
the help-seeking process. Asians with Schizophrenia were contained within the family
or communities and generally did not encounter mental health services until three years
after the onset of psychotic symptoms. In comparison, their Caucasian and African
American counterparts entered the mental health system within an average of one and
one and half years respectively after the onset of symptoms. [52] Another study also
found that students with Asian ancestry on US campuses were less like to use mental
health services compared to students of European origin. [53] These complications
from cultural influences are likely to result in underdiagnosis depending on cultural
backgrounds.
Unlike in Western countries, anxiety and depression can be unfamiliar terms for a
medical condition. For example, in China, depression is labelled “shen jing shuai ruo”
(neurasthenia). In India, “ghabrahat” (peculiar restlessness), and “pelo y tata” (heart too
much) in Botswana. [54] Similarly, in Zimbabwe, many depressed individuals assign
their symptoms to supernatural causes, overthinking, “deep sadness” or social stressors.
[55] Furthermore, in Zimbabwe, patients tend to move to traditional healthcare systems
after consultation with primary care providers, only a few turns to a mental health
professional. The primary health practitioners and traditional healers typically prescribe
non-specific treatments such as analgesics, hypnotics, or vitamins for their somatic
symptoms, limited numbers of patients are recognised for their psychiatric conditions
and are transferred to mental health workers for a better outcome. [54] These practices
due to cultural and social norms consequently lead to an underdiagnosis and
undertreatment of mental diseases.
Another factor that leads to the underdiagnosis of mental disorders is social stigma.
Studies found that Asian cultural norms do not recognise the importance of mental
disorders.[56] Furthermore, people from Eastern cultures reported that being mentally
ill was shameful [57], and they have less favourable help-seeking attitude toward
mental health support and lower levels of interpersonal openness compared to their
European American counterparts. [58] Research suggests there is greater stigma
associated with depressive disorders in Eastern nations, this partly stems from the lack
of economic contributions by the depressed individuals in the family, which further
exacerbates their depression. [59] Moreover, in countries with more dominant mental
health stigma beliefs, the likelihood of patients receiving mental health help from
trained professionals is reduced, and individuals also refrain from approaching general
practitioners regardless of their own stigma beliefs. [60]
In summary, mental illnesses are complex and their development is heavily influenced
by cultural, social, economic, and political circumstances. Although ICD-10 and DSM-
5 guidelines are acknowledged by mental health professionals globally, there is much
regional variation in criteria and clinical practices when diagnosing mental illnesses.
This complexity makes it extremely difficult to provide an accurate estimation of cases
of depression and anxiety disorders on a global scale. WHO estimates are unlikely to
be representative of the actual mental health burden worldwide. Consequently, the
relationship between “happiness” and depression and anxiety may not have been fully
addressed.
Conclusion
In conclusion, this review has provided an insight into the relationship between
“happiness” and the prevalence levels of anxiety and depression. Contrary to common
preconceptions - “happier” countries have lower levels of depression and anxiety
disorders. The statistical analysis showed no linear association between a country’s
world happiness index scores and its depression and anxiety prevalence. Nevertheless,
positive Pearson correlations were identified between the explanatory factors: GDP per
capita, healthy life expectations at birth, social support, and the prevalence of
depression and anxiety.
However, these findings do not explain the relationship between subjective wellbeing
and mental illnesses. There are several confounding factors behind these correlations,
such as inequality of income due to the modernisation process, increased recognition
of late-onset anxiety and depression disorders, and the survey design of the Gallup
World Poll. But the most important drawback of this epidemiological study is the
inability to compare mental health statistics. The WHO global mental health estimates
were not a comprehensive estimate of the true mental health burden. The true cases of
depression and anxiety are underestimated due to cultural influence and the lack of a
global “gold standard” in diagnosis.
All in all, both the topics of mental health and the concept of happiness are convoluted
in nature. The two topics have many overlapping influencing factors, but no direct
correlation can be observed between WHI scores and the prevalence of depression and
anxiety levels at the country level. Further research is required before the application
of WHI in psychiatric and public health studies.

Appendix:
Table 1 – Pearson’s correlation coefficient between depression prevalence and GDP per capita,
Life expectancy and Social support.
Depression
Prevalence
r
r
2
p=
n=
GDP per capita
0.579
0.335
0.00
150
Life expectancy
0.553
0.306
0.00
150
Social Support
0.411
0.169
0.00
150
Table 2 – Pearson’s correlation coefficient between anxiety prevalence and GDP per capita,
Life expectancy and Social support.
Anxiety
Prevalence
r
r
2
p=
n=
GDP per capita
0.507
0.257
0.00
150
Life expectancy
0.539
0.291
0.00
150
Social Support
0.366
0.134
0.00
150
References
1. Oishi, S., et al.,
Concepts of Happiness Across Time and
Cultures.
Personality and Social Psychology Bulletin,
2013.
39(5): p. 559- 577.
2. Steptoe, A.,
Happiness and Health.
Annual Review of
Public Health, 2019.
40(1): p. 339- 359.
3. Muthuri, R.N.D.K., F. Senkubuge, and C. Hongoro,
Determinants of happiness among healthcare
professionals between 2009 and 2019: a systematic
review.
Humanities and Social Sciences
Communications, 2020.
7(1): p. 98.
4. Helliwell, J.a.L., Richard and Sachs, Jeffrey (eds.)
World
happiness report 2012
, in
World happiness report
, J.
Sachs, Editor. 2012, The Earth Institute, Columbia
University: New York, USA. .
5. Lyubomirsky, S., L. King, and E. Diener,
The benefits of
frequent positive affect: does happiness lead to
success?
Psychol Bull, 2005. 131(6): p. 803- 55.
6. Savage, M.
Being depressed in the 'world's happiest

country'
. BBC Worklife 2019 [cited 2022 21/06];
Available from:
https://answers.frederick.edu/citations/faq/304627
.
7. Michael T. Compton, M.D. , M.P.H. , and and Ruth S.
Shim, M.D., M.P.H.,
The Social Determinants of Mental
Health.
FOCUS, 2015. 13(4): p. 419- 425.
8. Helliwell, J., Layard, R., & Sachs, J.,
World Happiness
Report 2017
, in
World Happiness Report
, R.L. John
Helliwell, Jeffrey Sachs, Jan- Emmanuel De Neve,
Haifang Huang and Shun Wang, Editor. 2017,
Sustainable Development Solutions Network.: New
York.
9. John Helliwell, R.L., Jeffrey D. Sachs, Jan- Emmanuel De
Neve, Lara B. Aknin, Shun Wang; and Sharon Paculor,
World Happiness Report 2022
, in
World Happiness
Report
, R.L. John Helliwell, Jeffrey D. Sachs, Jan-
Emmanuel De Neve, Lara B. Aknin, Shun Wang; and
Sharon Paculor, Editor. 2022, Sustainable Development
Solutions Network: New York.
10. Gariépy, G., H. Honkaniemi, and A. Quesnel- Vallée,
Social support and protection from depression:
systematic review of current findings in Western
countries.
British Journal of Psychiatry, 2016. 209(4): p.
284- 293.
11. Ioannou, M., A.P. Kassianos, and M. Symeou,
Coping
With Depressive Symptoms in Young Adults: Perceived
Social Support Protects Against Depressive Symptoms
Only Under Moderate Levels of Stress.
Frontiers in
psychology, 2019.
9: p. 2780- 2780.
12. Biehle, S.N. and K.D. Mickelson,
Provision and receipt
of emotional spousal support: The impact of visibility
on well- being.
Couple and Family Psychology:
Research and Practice, 2012.
1(3): p. 244.
13. Lam, R.W., et al.,
Cognitive dysfunction in major
depressive disorder: effects on psychosocial
functioning and implications for treatment.
Can J
Psychiatry, 2014.
59(12): p. 649- 54.
14. Meynen, G.,
Free will and mental disorder: exploring
the relationship.
Theor Med Bioeth, 2010. 31(6): p.
429- 43.
15. Moll, J., et al.,
Human fronto- mesolimbic networks
guide decisions about charitable donation.
Proc Natl
Acad Sci U S A, 2006.
103(42): p. 15623- 8.
16. Evans- Lacko, S., et al.,
Socio- economic variations in
the mental health treatment gap for people with
anxiety, mood, and substance use disorders: results
from the WHO World Mental Health (WMH) surveys.
Psychol Med, 2018.
48(9): p. 1560- 1571.
17. World Health, O.,
The WHO special initiative for mental
health (2019- 2023): universal health coverage for
mental health
. 2019, World Health Organization:
Geneva.
18. Rehm, J. and K.D. Shield,
Global Burden of Disease and
the Impact of Mental and Addictive Disorders.
Curr
Psychiatry Rep, 2019.
21(2): p. 10.
19. Pratt, L.A., et al.,
Excess mortality due to depression
and anxiety in the United States: results from a
nationally representative survey.
Gen Hosp Psychiatry,
2016.
39: p. 39- 45.
20. Sharma, S., S. Singhal, and F. Tarp,
Corruption and
mental health: Evidence from Vietnam.
Journal of
Economic Behavior & Organization, 2021.
185: p. 125-
137.
21. Helliwell, J.F., Richard Layard, and Jeffrey Sachs, eds,
World Happiness Report 2013
, in
World Happiness
Report
R.L.a.J.S. John Helliwell, Editor. 2013, UN
Sustainable Development Solutions Network.: New
York.
22. Helliwell, J., Layard, R., & Sachs, J.,
World Happiness
Report 2018
, in
World Happiness Report
, R.L.a.J.D.S.
John F. Helliwell, Editor. 2018, Sustainable
Development Solutions Network: New York.
23. Luppino, F.S., et al.,
Overweight, obesity, and
depression: a systematic review and meta- analysis of
longitudinal studies.
Arch Gen Psychiatry, 2010. 67(3):
p. 220- 9.
24. Helliwell, J., Layard, R., & Sachs, J.,
World Happiness
Report 2019
, in
World Happiness Report
R.L.a.J.D.S.
John F. Helliwell, Editor. 2019, Sustainable
Development Solutions Network: New York.
25. Goldenberg, A., et al.,
Collective Emotions.
Current
Directions in Psychological Science, 2020.
29(2): p.
154- 160.
26. Rimé, B.,
Emotion Elicits the Social Sharing of Emotion:
Theory and Empirical Review.
Emotion Review, 2009.
1(1): p. 60- 85.
27. StataCorp.
Stata Statistical Software: Release 17.
[17.0]
2021.

28. Organization, W.H.,
Depression and other common
mental disorders: global health estimates.
, W.H.
Organization, Editor. 2017.
29. Saloni Dattani, H.R.a.M.R.
Mental Health
. Our World in
Data 2021 [cited 2022 02/05]; Available from:
https://ourworldindata.org/mental- health
.
30. Network, G.B.o.D.C.,
Global Burden of Disease Study
(GBD 2019)
. 2019, Institute for Health Metrics and
Evaluation (IHME): Seattle , United States.
31. Ettman, C.K., G.H. Cohen, and S. Galea,
Is wealth
associated with depressive symptoms in the United
States?
Ann Epidemiol, 2020. 43: p. 25- 31.e1.
32. Ridley, M., et al.,
Poverty, depression, and anxiety:
Causal evidence and mechanisms.
Science, 2020.
370(6522): p. eaay0214.
33. Finkelstein, A., et al.,
THE OREGON HEALTH
INSURANCE EXPERIMENT: EVIDENCE FROM THE FIRST
YEAR.
Q J Econ, 2012. 127(3): p. 1057- 1106.
34. Lee, S., et al.,
Lifetime prevalence and inter- cohort
variation in DSM- IV disorders in metropolitan China.
Psychological Medicine, 2007.
37(1): p. 61- 71.
35. Hidaka, B.H.,
Depression as a disease of modernity:
Explanations for increasing prevalence.
Journal of
Affective Disorders, 2012.
140(3): p. 205- 214.
36. Plana- Ripoll, O., et al.,
A comprehensive analysis of
mortality- related health metrics associated with mental
disorders: a nationwide, register- based cohort study.
The Lancet, 2019.
394(10211): p. 1827- 1835.
37. de Lijster, J., et al.,
The age of onset of anxiety
disorders in samples from the general population: A
meta- analysis.
European Psychiatry, 2016. 33: p. S56-
S57.
38. Le Roux, H., M. Gatz, and J.L. Wetherell,
Age at onset
of generalized anxiety disorder in older adults.
Am J
Geriatr Psychiatry, 2005.
13(1): p. 23- 30.
39. Lenze, E.J., et al.,
Generalized anxiety disorder in late
life: lifetime course and comorbidity with major
depressive disorder.
Am J Geriatr Psychiatry, 2005.
13(1): p. 77- 80.
40. Boudreault- Bouchard, A.M., et al.,
Impact of parental
emotional support and coercive control on
adolescents' self- esteem and psychological distress:
results of a four- year longitudinal study.
J Adolesc,
2013.
36(4): p. 695- 704.
41. Okun, M.A. and V.M. Keith,
Effects of positive and
negative social exchanges with various sources on
depressive symptoms in younger and older adults.
J
Gerontol B Psychol Sci Soc Sci, 1998.
53(1): p. P4- 20.
42. Simon, R.W. and A.E. Barrett,
Nonmarital romantic
relationships and mental health in early adulthood:
does the association differ for women and men?
J
Health Soc Behav, 2010.
51(2): p. 168- 82.
43. Stafford, M., et al.,
Positive and negative exchanges in
social relationships as predictors of depression:
evidence from the English Longitudinal Study of Aging.
J Aging Health, 2011.
23(4): p. 607- 28.
44. Hara, K.,
The Concept of Omoiyari (Altruistic Sensitivity)
in Japanese Relational Communication.
Intercultural
Communication Studies, 2006.
15.
45. Jacob, K.S., et al.,
Mental health systems in countries:
where are we now?
Lancet, 2007. 370(9592): p. 1061-
77.
46. Organization, W.H.,
The global burden of disease: 2004
update
. 2008: World Health Organization.
47. Chen, Y.F.,
Chinese classification of mental disorders
(CCMD- 3): towards integration in international
classification.
Psychopathology, 2002. 35(2- 3): p. 171-
5.
48. Tamura, N.,
[Current Status of Clinical Practice
Guidelines for Mental Health in Japan].
Seishin
Shinkeigaku Zasshi, 2017.
119(3): p. 151- 157.
49. Lin, K.- M. and F. Cheung,
Mental Health Issues for
Asian Americans.
Psychiatric Services, 1999. 50(6): p.
774- 780.
50. Cheung, F.M. and B.W. Lau,
Situational variations of
help- seeking behavior among Chinese patients.
Comprehensive Psychiatry, 1982.
51. Cheung, F.M.,
An overview of psychopathology in
Hong Kong with special reference to somatic
presentation.
Chinese culture and mental health, 1985:
p. 287- 304.
52. Lin, T.- Y. and M.- C. Lin,
Service delivery issues in
Asian- North American communities.
The American
Journal of Psychiatry, 1978.
53. Han, M. and H. Pong,
Mental health help- seeking
behaviors among Asian American community college
students: The effect of stigma, cultural barriers, and
acculturation.
Journal of College Student Development,
2015. 56(1): p. 1- 14.
54. Patel, V., et al.,
Depression in developing countries:
lessons from Zimbabwe.
Bmj, 2001. 322(7284): p. 482-
4.
55. Abas, M.A. and J.C. Broadhead,
Depression and anxiety
among women in an urban setting in Zimbabwe.
Psychol Med, 1997.
27(1): p. 59- 71.
56. Lee, S., et al.,
Model Minority at Risk: Expressed Needs
of Mental Health by Asian American Young Adults.
Journal of Community Health, 2008.
34(2): p. 144.
57. Kung, W.W.,
Cultural and practical barriers to seeking
mental health treatment for Chinese Americans.
Journal of Community Psychology, 2004.
32(1): p. 27-
43.
58. Masuda, A. and M.S. Boone,
Mental Health Stigma,
Self- Concealment, and Help- Seeking Attitudes among
Asian American and European American College
Students with No Help- Seeking Experience.
International Journal for the Advancement of
Counselling, 2011.
33(4): p. 266- 279.
59. Krendl, A.C. and B.A. Pescosolido,
Countries and
Cultural Differences in the Stigma of Mental Illness: The
East–West Divide.
Journal of Cross- Cultural
Psychology, 2020.
51(2): p. 149- 167.
60. Bracke, P., K. Delaruelle, and M. Verhaeghe,
Dominant
Cultural and Personal Stigma Beliefs and the Utilization
of Mental Health Services: A Cross- National
Comparison.
Frontiers in Sociology, 2019. 4.
