
U.S. Property & Casualty and Title Insurance Industries – 2023 First Half Results
© 2023 National Association of Insurance Commissioners [1]
Property & Casualty Insurance Industry
PROPERTY & CASUALTY OVERVIEW
The first half of 2023 was challenging for P&C insurers due to continued
inflationary pressures and natural catastrophes which led to the largest mid-year
underwiting loss in over a decade and drove net income down nearly 70%
compared to a year ago. A recovery in equity markets produced unrealized
investment gains versus significant losses last year, resulting in a rebound in
policyholders’s surplus to $1.1 trillion at June 30, 2023.
While the long trend of industry profits continued into the first half of 2023,
operating results in the second half of the year have the potential to be impacted
by a number of factors including, natural catastrophes, economic inflation, and
high reinsurance costs.
U.S. Property/Casualty Insurance Industry Results
For the six months ended
June 30,
Chg. 2023 2022 2021 2020 2019 2018 2017 2016 2015 2014
Direct Premiums Written 10.3%
$478.6 $434.0 $394.8 $362.3 $355.2 $340.6 $321.3 $306.9 $295.5 $282.8
Net Premiums Written 9.2%
$424.3 $388.6 $351.2 $327.6 $315.3 $316.7 $280.4 $268.8 $261.
1 $251.4
Net Premiums Earned 8.6%
$395.5 $364.1 $333.3 $316.6 $308.3 $297.4 $270.4 $261.6 $252.
5 $243.0
Net Loss & LAE Incurred 16.1%
$310.8 $267.8 $231.9 $217.2 $215.8 $204.9 $197.5 $186.9 $175.0 $171.8
Underwriting Expenses 6.2%
$106.4 $100.2 $93.7 $90.2 $85.4 $85.3 $75.8 $74.5 $72.4 $69.3
Underwriting Gain (Loss) (407.8%)
($22.2) ($4.4) $7.3 $8.9 $6.5 $7.0 ($3.2) ($0.2) $4.
7 $1.5
Net Loss Ratio 5.0 pts
78.6% 73.5% 69.6% 68.6% 70.0% 68.9% 73.0% 71.4% 69.3% 70.7%
Expense Ratio (0.5) pts
25.2% 25.8% 26.7% 27.5% 27.1% 26.9% 27.0% 27.7% 27.
7% 27.6%
Dividend Ratio (0.1) pts
0.38% 0.47% 0.71% 1.55% 0.55% 0.53% 0.54% 0.55% 0.
53% 0.57%
Combined Ratio 4.4 pts
104.2% 99.8% 96.9% 97.7% 97.6% 96.3% 100.6% 99.7% 97.6% 98.8%
Investment Inc. Earned (12.1%)
$34.5 $39.3 $28.9 $28.3 $29.3 $28.9 $25.6 $24.2 $24.7 $25.2
Realized Gains (Losses) (33.8%)
$2.4 $3.6 $9.7 ($0.9) $4.6 $5.5 $3.9 $4.8 $8.5 $7.6
Investment Gain (Loss) (13.9%)
$36.9 $42.9 $38.6 $27.4 $33.9 $34.4 $29.5 $29.0 $33.
2 $32.8
Investment Yield (a) (0.56)-pts 3.19% 3.75% 2.90% 3.15% 3.47% 3.50% 3.
28% 3.24% 3.32% 3.48%
Net Income (b) (69.2%)
$10.4 $33.8 $39.8 $26.8 $34.8 $35.8 $17.7 $22.2 $32.7 $28.5
Return on Revenue (5.9)-pts 2.4% 8.3% 10.7% 7.8% 10.2% 10.8% 5.
9% 7.6% 11.4% 10.3%
June 30,
Chg. 2023 2022 2021 2020 2019 2018 2017 2016 2015 2014
Capital & Surplus (b) 7.1%
$1,071.6 $1,000.9 $1,077.6 $955.1 $891.2 $780.0 $786.0 $734.0 $705.9 $706.7
(a) annualized, (b) adjusted to removed stacked entities
NM = Not Meaningful
December 31, 2014-2022
(in billions, except for percent)
Inside the Report
Page No.
Market Conditions ....................... 2
Writings ....................................... 3
Underwriting Operations .......... 4,5
Investment Operations ................ 5
Net Income .................................. 6
Cash Flow & Liquidity .................. 6
Capital & Surplus ......................... 6
Reserves ...................................... 7
Title Industry ............................ 7-8

U.S. Property & Casualty and Title Insurance Industries – 2023 First Half Results
© 2023 National Association of Insurance Commissioners [2]
MARKET CONDITIONS
Premium Pricing
Hard market conditions continued in the U.S. Property & Casualty insurance industry in most lines of business.
Inflationary pressures have driven up property valuations leading to higher rates. According to the Council of Insurance
Agents and Brokers (CIAB) Commercial Property/Casualty Market Report Q2 2023 (April 1 – June 30), Q2 2023 was the
twenty-third consecutive quarter of increased commercial premiums with respondents reporting an average increase
of 8.9% across all account sizes, compared to 8.8% in Q1.
The report noted that the commercial property line was the outlier in terms of premium pricing, increasing 18.3% in
the second quarter. Rising property values and increased frequency and severity of natural disasters were compounded
by decreased reinsurance placement. Workers’ compensation recorded its sixth consecutive quarter of rate decreases
while commercial auto rates increased 10.4%, marking fifty consecutive quarters of premium increases.
Capacity
Despite hard market conditions and worsening
underwriting results, the industry has recorded a long
trend of profits, boosting capital levels and keeping
the net writings leverage ratio under 80% since 2009.
Headwinds created by increased natural disasters and
inflationary pressures impacting personal lines
results, rising interest rates weighing on investment
returns, and higher reinsurance costs will challenge
insurers bottom lines in the second half of the year.
Despite these challenges capital remains strong.
76.3%
65%
70%
75%
80%
85%
90%
95%
100%
'08 '09 '10 '11 '12 '13 '14 '15 '16 '17 '18 '19 '20 '21 '22 Jun-
23
Net Writings Leverage
U.S. Property & Casualty and Title Insurance Industries – 2023 First Half Results
© 2023 National Association of Insurance Commissioners [3]
WRITINGS
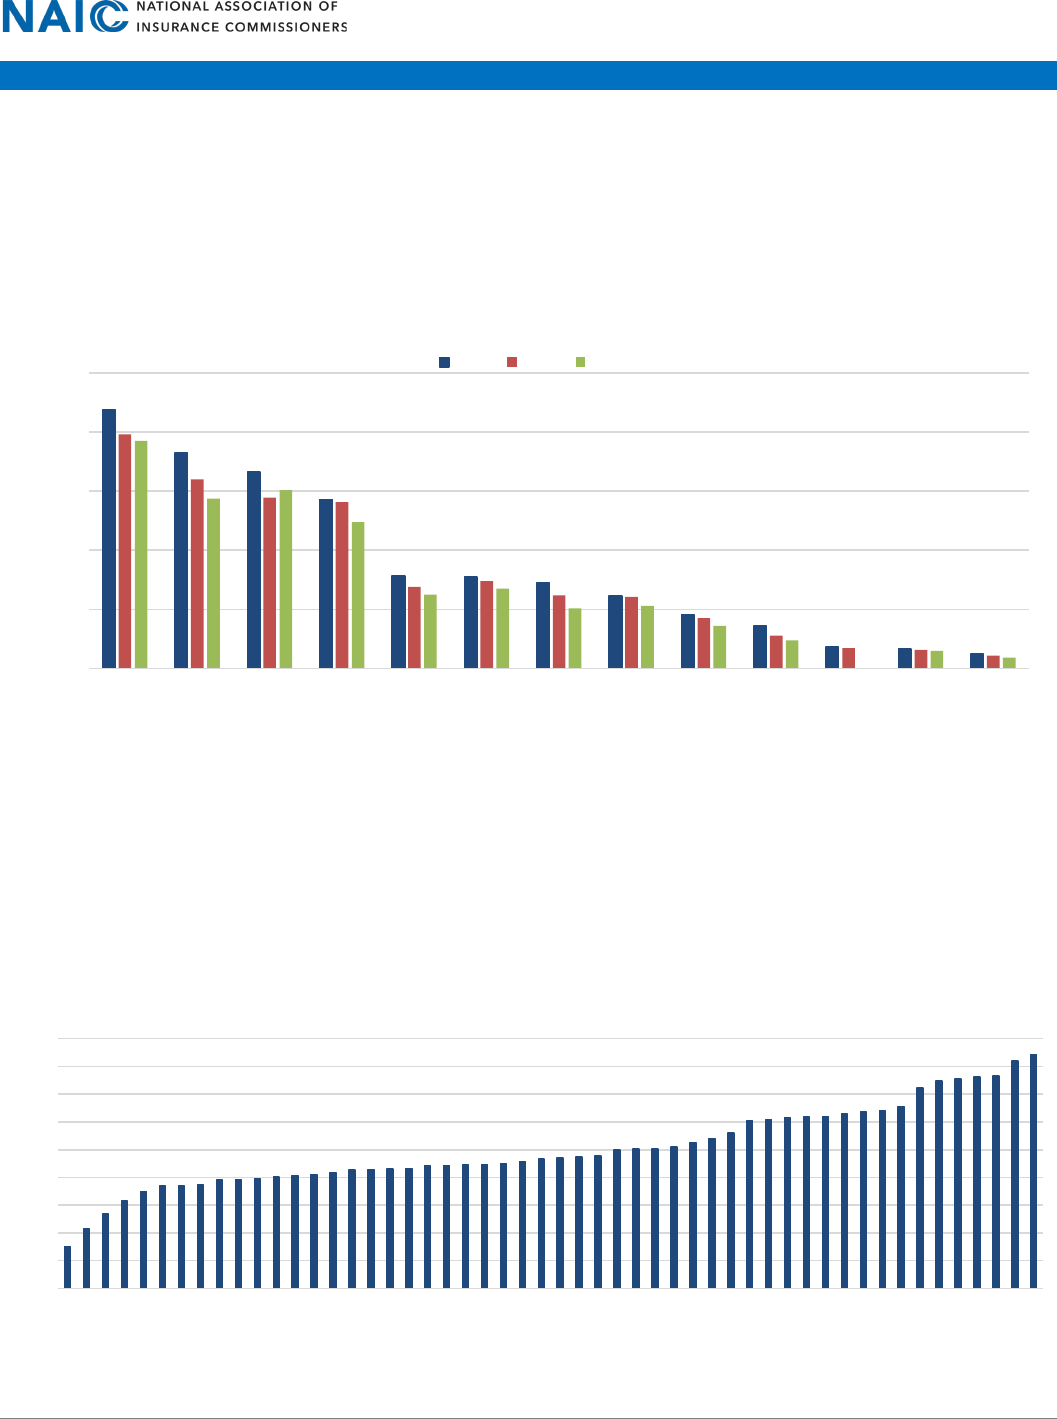
Direct premiums written (DPW) increased 10.3% to $478.6 billion in the first half of 2023 compared to $434.0 billion
for the same period in 2022. Construction material and labor cost increases resulted in higher claim payouts for
property lines. Additionally, auto repair costs have increased due to the higher cost of parts and labor, leading to
higher claims payouts. Insurers have responded by increasing premiums in nearly all major lines. The most notable
change was in the homeowners line, where premiums increased 14.1% YoY and 27.0% compared to mid-year 2021.
The auto liability and physical damage lines experienced YoY increases of 10.5% and 15.1%, respectively. The chart
below shows the DPW for the industry’s top lines of business for the last three mid-year periods.
Geographically, nearly all states and territories experienced DPW growth. California recorded the greatest market
share at 11.4% and DPW increased 7.4% YoY. Both Texas and Florida recorded the next highest market share at 9.7%
and 9.5%, respectively, and each saw premium increases of over 16.0%.
$0.0
$20.0
$40.0
$60.0
$80.0
$100.0
Prvt Psgr Auto Liability
Homeowners MP
Auto Physical Damage
Other Liability
Commercial Multiple
Peril
Workers'
Compensation
Allied Lines
Commercial Auto
Liability
Inland Marine
Fire
Commercial Auto
Physical Damage
Medical Prof Liab
Surety
DPW Change by LOB - Current Year to Date ($B)
2Q23 2Q22 2Q21
0%
2%
4%
6%
8%
10%
12%
14%
16%
18%
VI
ID
DE
CT
WA
NY
MI
CA
MD
ND
AK
MA
WI
PA
IL
WV
IA
VT
KS
IN
NE
NV
HI
KY
NJ
NH
MN
MT
MS
RI
OH
GA
ME
NC
VA
OK
TN
MO
AL
SD
LA
AR
CO
UT
OR
AZ
PR
WY
SC
NM
TX
FL
Geographic Change in DPW (CYTD to PYTD)

U.S. Property & Casualty and Title Insurance Industries – 2023 First Half Results
© 2023 National Association of Insurance Commissioners [4]
UNDERWRITING OPERATIONS
The P&C industry recorded a $22.2 billion underwriting
loss for the first half of 2023, its second consecutive mid-
year loss and the largest mid-year loss since 2011.
Despite substantial pricing and underwriting actions
taken by insurers, the personal lines segment continued
its downturn primarily due to the high inflation and
natural catastrophes which were significantly higher at
an estimated $32 billion in the U.S. in the first half of 2023
compared to $19 billion for the same period last year. In
contrast, commercial lines results were favorable due to
a trend of rate increases and tighter underwriting
guidelines in most lines since the fourth quarter of 2018.
For the current period, net premiums earned increased
8.6% to $395.5 billion while net losses and LAE incurred
increased 16.1% to $310.8 billion resulting in a 5.0-point
deterioration in the net loss ratio to 78.6%. The expense
ratio experienced a minor improvement to 25.2% due to
net premium written growth. Overall, the combined ratio deteriorated 4.4-points to 104.2%.
The recent challenges with underwriting profitability in the P&C industry is largely attributed to personal lines
performance. Personal auto lines experienced an increase in accident frequency after the pandemic related shutdowns
were lifted and traffic volumes returned to normal. Inflation hit a 40-year high in mid-year 2022 and continues to wreak
havoc on the cost of claims during the second half of 2023. Additionally, the homeowners line has been challenged by
natural catastrophes as well as inflation which is driving up replacement costs. The $32 billion in insured losses related
to natural catastrophes in the first half of the year contributed 8.1-points to the overall industry’s net loss ratio of
78.6%. The chart below shows the pure direct loss ratio (PDLR) by segment for the last ten mid-year periods.
90%
95%
100%
105%
110%
$180
$230
$280
$330
$380
$430
'14 '15 '16 '17 '18 '19 '20 '21 '22 '23
($B)
Earned Prem Loss, LAE, & U/W Exp Combined Ratio
Underwriting Income (Six months ended June 30)
78.4%
58.1%
67.6%
40%
45%
50%
55%
60%
65%
70%
75%
80%
85%
2014 2015 2016 2017 2018 2019 2020 2021 2022 2023
Pure Direct Loss Ratio
Six Months Ended June 30
Personal Lines Commercial Lines All P&C Lines

U.S. Property & Casualty and Title Insurance Industries – 2023 First Half Results
© 2023 National Association of Insurance Commissioners [5]
Within the personal lines segment, the PDLR for the homeowners line deteriorated sharply to 81.2% in the current
period compared to 66.2% for the same period last year. The private passenger auto liability line worsened 3.6-points
to 75.6% while personal auto physical damage improved 1.0-point but still remained elevated at 79.1%. The
commercial lines segment results were favorable as evidenced by a PDLR of 58.1%, however, the commercial multiple
peril line experienced an 11.1-point deterioration to 64.2% driven by higher property loss costs resulting in a 69.8%
PDLR in the non-liability portion and an overall PDLR of 64.2%. The workers’ compensation line has seen eight plus
years of underwriting profits primarily due to the release of prior year reserves.
INVESTMENT OPERATIONS
Investment gains were 13.9% lower than the first half of last year, totaling $36.9 billion for the six months ended June
30, 2023. Net investment income earned was 12.1% lower while fluctuations in equity markets produced a 33.8%
decrease in realized capital gains to $2.4 billion compared to $3.6 billion a year ago and a 75.3% decrease compared
to June 30, 2021.
Investment yield (annualized) was 3.19% versus 3.75%
for the prior year period due to the 12.1% decrease in
net investment income earned. The main vehicle for
investment income was bonds, which leaves insurers
exposed to interest rate risk. To combat inflation, the
U.S. Federal Reserve (Fed) increased the federal funds
rate four times in 2023. The Fed raised the rate by one
quarter of a point in July, bringing the benchmark
interest rate up to a target range of 5.25-5.50%, the
highest since 2008.
Bonds comprised the majority of the industry’s cash and
invested assets at 49.2%, while unaffiliated common
stocks were 20.8%, affiliated common stocks 13.1%,
Schedule BA assets 7.7%, cash, cash equivalents and
short-term investments totaled 6.6%, mortgage loans
1.3%, and all other cash and invested assets 1.3%.
66.2%
72.0%
80.1%
48.4%
58.8%
53.1%
68.6%
81.2%
75.6%
79.1%
48.6%
57.9%
64.2%
72.9%
Homeowners Prvt. Psgr. Auto
Liability
Prvt. Psgr. Auto
Physical Dmg.
Workers' Comp Other Liability Commercial
Multiple Peril
Commercial Auto
Liability
PDLR Primary Lines of Business
2Q22 2Q23
0.0%
0.5%
1.0%
1.5%
2.0%
2.5%
3.0%
3.5%
4.0%
$10.0
$15.0
$20.0
$25.0
$30.0
$35.0
$40.0
$45.0
'14 '15 '16 '17 '18 '19 '20 '21 '22 '23
Investment Income (Six months ended June 30)
Investment Income ($B) Investment Yield (Annualized)

U.S. Property & Casualty and Title Insurance Industries – 2023 First Half Results
© 2023 National Association of Insurance Commissioners [6]
NET INCOME
Net income of $10.4 billion was 69.2% lower compared
to the same period last year. The steep underwriting
loss was offset by investment gains to continue the long
trend of industry profits.
Return on revenue (RoR) of 2.4% was 5.9-points lower
compared to last year’s RoR of 8.3% as net income was
significantly lower in relation to net premiums earned
and investment gains.
CASH FLOW & LIQUIDITY
Net cash provided by operating activities decreased
19.8% compared to the same period in 2022 to $38.6
billion. The deterioration stemmed from an 18.4%
increase in benefit and loss related payments as higher
loss costs in personal lines continued. Partially
offsetting the increase in loss payments was an 11.8%
increase in premiums collected net of reinsurance.
The liquidity ratio worsened 0.3-points but remained
solid at 80.0% at June 30, 2023. Liquid assets increased
8.0% while adjusted liabilities increased 8.3%.
CAPITAL & SURPLUS
Industry aggregated policyholders’ surplus (adjusted to
eliminate stacking) totaled $1.1 trillion at June 30,
2023, a 7.1% increase compared to $1.0 trillion at
December 31, 2022. Although net income was lower
compared to last year, insurers reported unrealized
capital gains of $70.8 billion compared to unrealized
capital losses of $122.3 billion for the same period a
year ago.
0%
2%
4%
6%
8%
10%
12%
14%
$0
$5
$10
$15
$20
$25
$30
$35
$40
$45
'14 '15 '16 '17 '18 '19 '20 '21 '22 '23
Net Income (Six months ended June 30)
Net Income ($B) ROR
$23.3
$22.9
$26.1
$16.0
$40.8
$37.2
$45.9
$64.2
$48.2
$38.6
$0
$10
$20
$30
$40
$50
$60
$70
'14 '15 '16 '17 '18 '19 '20 '21 '22 '23
(Billions)
Cash from Operations (Six months ended June 30)
1,071,611
$200
$300
$400
$500
$600
$700
$800
$900
$1,000
$1,100
'05 '07 '09 '11 '13 '15 '17 19 21 6/30/2023
Capital & Surplus ($B)

U.S. Property & Casualty and Title Insurance Industries – 2023 First Half Results
© 2023 National Association of Insurance Commissioners [7]
RESERVES
Loss and LAE reserves increased 2.6% since the prior
year-end to $882.0 billion at June 30, 2023, and was
comprised of $741.2 billion unpaid losses and $140.8
billion unpaid LAE. For the current period, reserve
leverage improved 3.6-points to 82.3% compared to
85.9% at the prior year-end attributable to the increase
in surplus.
The trend in net favorable loss reserve development
continued with an overall redundancy of $5.4 billion in
the first half of 2023, which consisted of a $71.2 billion
redundancy in prior year IBNR loss and LAE reserves,
partially offset by a $65.8 billion deficiency in prior year
known case loss and LAE reserves.
Title Industry
Title Industry Results
For the six months
ended June 30,
YoY Chg. 2023 2022 2021 2020 2019
Direct Premiums Written
(39.9)% $7,356 $12,234 $12,315 $8,136 $6,913
Direct Ops.
(41.9)% $751 $1,292 $1,226 $863 $854
Non-Aff. Agency Ops.
(41.2)% $4,715 $8,022 $7,997 $5,211 $4,257
Aff. Agency Ops.
(35.3)% $1,890 $2,919 $3,092 $2,063 $1,803
Premiums Earned
(38.0)% $7,438 $11,988 $11,969 $8,034 $6,871
Loss & LAE Incurred
16.0% $363 $313 $285 $255 $283
Operating Exp Incurred
(36.1)% $7,324 $11,461 $11,454 $7,828 $6,710
Net Operating Gain/(Loss)
(70.8)% $317 $1,085 $1,190 $633 $465
Net Inv. Income Earned
55.1% $274 $177 $168 $203 $202
Net Realized Gain/(Loss)
NM $(21) $77 $25 $(26) $44
Net Inv. Gain (Loss)
(0.3)% $254 $254 $193 $178 $247
Net Income
(56.7)% $473 $1,093 $1,108 $675 $585
Loss Ratio
2.3-pts 4.9% 2.6% 2.4% 3.2% 4.1%
Expense Ratio
2.9-pts 98.5% 95.6% 95.7% 97.5% 97.7%
Combined Ratio
5.1-pts 103.4% 98.2% 98.1% 100.6% 101.8%
Net Unrealized Gain/(Loss)
NM $14 $(667) $270 $(187) $215
Net Cash from Operations
(84.3)% $138 $879 $1,286 $689 $348
NM=Not Meaningful
(in millions, except for percent data)
$882.0
70%
75%
80%
85%
90%
95%
100%
$500
$550
$600
$650
$700
$750
$800
$850
$900
'13 '14 '15 '16 '17 '18 '19 '20 '21 '22 6/23
Loss & LAE Reserves ($B)
Loss & LAE Reserves Reserve Leverage

U.S. Property & Casualty and Title Insurance Industries – 2023 First Half Results
© 2023 National Association of Insurance Commissioners [8]
Title Industry Overview
The U.S. Title sector recorded a 39.9% decline in DPW
compared to this time last year, reflecting a slowdown
in new housing starts driven by higher interest rates.
The decrease occurred in all three segments, direct
operations, affiliated operations, and non-affiliated
agency operations.
A net operating gain of $317.4 million was reported for
the first half of 2023, representing a 70.8% YoY
decrease compared to $1.1 billion for the first half of
2022, driven by a 38.0% decrease in earned premiums
while losses and loss adjustment expenses incurred
remained relatively unchanged. The mid-year
combined ratio of 103.4% was 5.1-points higher than
last year.
A net investment gain of $253.5 million was roughly the
same as the prior year period. Net investment income
earned was $274.1 million, a 55.1% increase compared
to 2022 while realized investment losses totaled $20.6
million versus realized gains of $77.0 million last year.
Overall, lower operating income drove a 56.7% decline
in net income to $473.3 million.
Policyholder Surplus (PHS) decreased 8.2% compared
to mid-year 2022. This decrease was primarily driven by
lower net income and $532.0 million in dividends to
stockholders and partially offset by unrealized
investment gains. The return on surplus decreased 8.1-
points YoY as the decrease in net income was greater
than the decline in surplus.
11.4%
12.1%
16.8%
16.1%
8.0%
6.0%
8.0%
10.0%
12.0%
14.0%
16.0%
18.0%
20.0%
$
$1,000
$2,000
$3,000
$4,000
$5,000
$6,000
$7,000
$8,000
2019 2020 2021 2022 2023 YTD
June 30 PHS ($M) and Return on Surplus
PHS ($M) Return on Surplus
$585
$675
$1,108
$1,093
$473
101.8%
100.6%
98.1%
98.2%
103.4%
97.0%
98.0%
99.0%
100.0%
101.0%
102.0%
103.0%
104.0%
$400
$500
$600
$700
$800
$900
$1,000
$1,100
$1,200
2019 2020 2021 2022 2023
Five Years of Net Income ($M) and the
Combined Ratio
Net Income Combined Ratio

U.S. Property & Casualty and Title Insurance Industries – 2023 First Half Results
© 2023 National Association of Insurance Commissioners [9]
NAIC Financial Regulatory Services
Financial Analysis and Examination Department
Contributors:
Brian Briggs, P/C Senior Financial Analyst
| 816.783.8925
Contacts:
Bruce Jenson, Assistant Director - Solvency Monitoring
BJenso[email protected]
| 816.783.8348
Andy Daleo, Senior Manager – P/C Domestic and International Analysis
| 816.783.8141
Rodney Good, P/C & Title Financial Analysis Manager II
| 816.783.8430
DISCLAIMER
The NAIC 2023 Mid-
Year Property/Casualty & Title Insurance Industry Analysis Report is a limited scope analysis based on the aggregated
information filed to the NAIC’s Financial Data Repository as of June 30, 2023 and written by the Financial Regulatory Services Department staff.
This report does not constitute the official opinion or views of the NAIC membership or any particular state insurance department.
