
Japanʼs Strategic Energy Plan
April 12
th
, 2018
Agency for Natural Resources and Energies

Japanʼs Energy Balance in History
Source: Prepared based on “Comprehensive Energy Statistics 2016” issued by the Agency for Natural Resources and Energy.
* “Renewables etc.” consists of solar power (1.5%), wind power (0.2%), geothermal heat (0.1%),
and biomass (1.9%), effective recovery use of wasted energy(2.2%).
Post war reconstruction
(1950s)
Rapid economic
growth(1960-)
Two oil crises
(1970s)
Liberalization of markets
and global warming
(1990s-)
Great East Japan Earthquake
and 1F accidents
(2011-)
From domestic coal
to petroleum
(1960s)
・From oil to gas and nuclear
・the world’s high level of energy efficiency
・Focus of Nuclear
・Focus of Renewable
2015
• Japan has made decision to secure energy supply to adopt different changes
60’s︓national coal to oil, 70’s︓Oil crisis, 90’s︓Liberalization and global warming, in 2011︓the Great East
Earthquake and Fukushima Accident
• Toward the goal of Paris Agreement, Japan should make decision
1

Japanʼs Strategic Energy Plan
Based on the Strategic Energy Plan, Japan tackles the policy targets related to Safety, Energy security,
Economic efficiency, and Environment simultaneously.(3E+S)
The Plan also refers reducing dependence on nuclear power generation as much as possible by promoting
energy efficiency and conservation, introduction of renewable energy, and introduction of efficient thermal
power plants.
Economic
efficiency
Energy
security
Self-sufficiency: About 25%, higher than
before the earthquake (about 20%)
Electricity cost: To lower from the current level
(9.7 trillion yen in FY2013 to 9.5 trillion yen in FY2030)
<Policy target for 3E+S>
Environment
Greenhouse gas emission reduction target:
(reduction of 26.0% in FY 2030 compared to FY 2013)
Safety is the top priority.
Safety
2

2030F
Y
2016F
Y
2010F
Y
Renewables 7%
Nuclear 11%
Fossil fuels: 82%
Gas 19%
Oil 40%
Coal 23%
Nuclear 0%
Renewables
13-14%
Nuclear
11-10%
Fossil fuels: 76%
Gas 18%
Oil 33%
Coal 25%
Fossil fuels: 89%
Gas 25%
Oil 39%
Coal 25%
Renewables 10%
Renewables
22-24%
Nuclear
22-20%
Renewables 15%
Renewables 10%
Nuclear 26%
Fossil fuels: 64%
Gas 28%
Oil 9%
Coal 27%
Fossil fuels: 84%
Gas 40%
Oil 12%
Coal 32%
Fossil fuels: 56%
Gas 27%
Oil 3%
Coal 26%
Fossil fuels
Non-fossil fuels
Wind 1.7%
Geothermal
1.0-1.1%
Solar 7.0%
Biomass
3.7-4.6%
Hydro
8.8-9.2%
Nuclear 2%
Primary energy
Power
• Energy Mix is a forecast and also a vison of a desired energy structure.
the goals of
“Energy security”, “Economic efficiency” and “Environment” are achieved
3
Energy Mix in Japan

Low Self sufficiency Rate
Source: IEA Energy Balances 2017
U.S.
Self Sufficiency
(2000)
Self Sufficiency
(2016)
54%
France
Germany
China
India
Japan
52%
20%
8%
73% 88%
37%40%
65%80%
84%98%
*China/India = 2015
Primary Nationally
Produced Resources
Natural Gas
Coal, Petroleum
Coal
Nuclear Power
Coal
Coal
None
U.K.
67%74%
Petroleum
*Japan’s self sufficiency ratios estimated by Agency for Natural Resources and Energy
• There are no nationally resources. It’s important to improve the self sufficiency rate.
4

5
Japanʼs imports are particularly reliant on the Middle East.
What will be the long-term situation there?

History of Introduction of RES
○FIT system introduced in 2012 causes 2.7 times increase in Renewables.
○The purchase costs reached 2.3 trillion yen (about 20.9 billion US dollars) and the levy burden to
average households amount up to 686 yen/month (about 6.1 US dollars/month)
RPS S
y
stem
FIT system
(FY)
Excess Electricity
Purchasing Scheme
(10MW)
Solar PV
Wind power
Middle and small hydropower
Geothermal
Biomass
Average annual
growth rate
29%
6

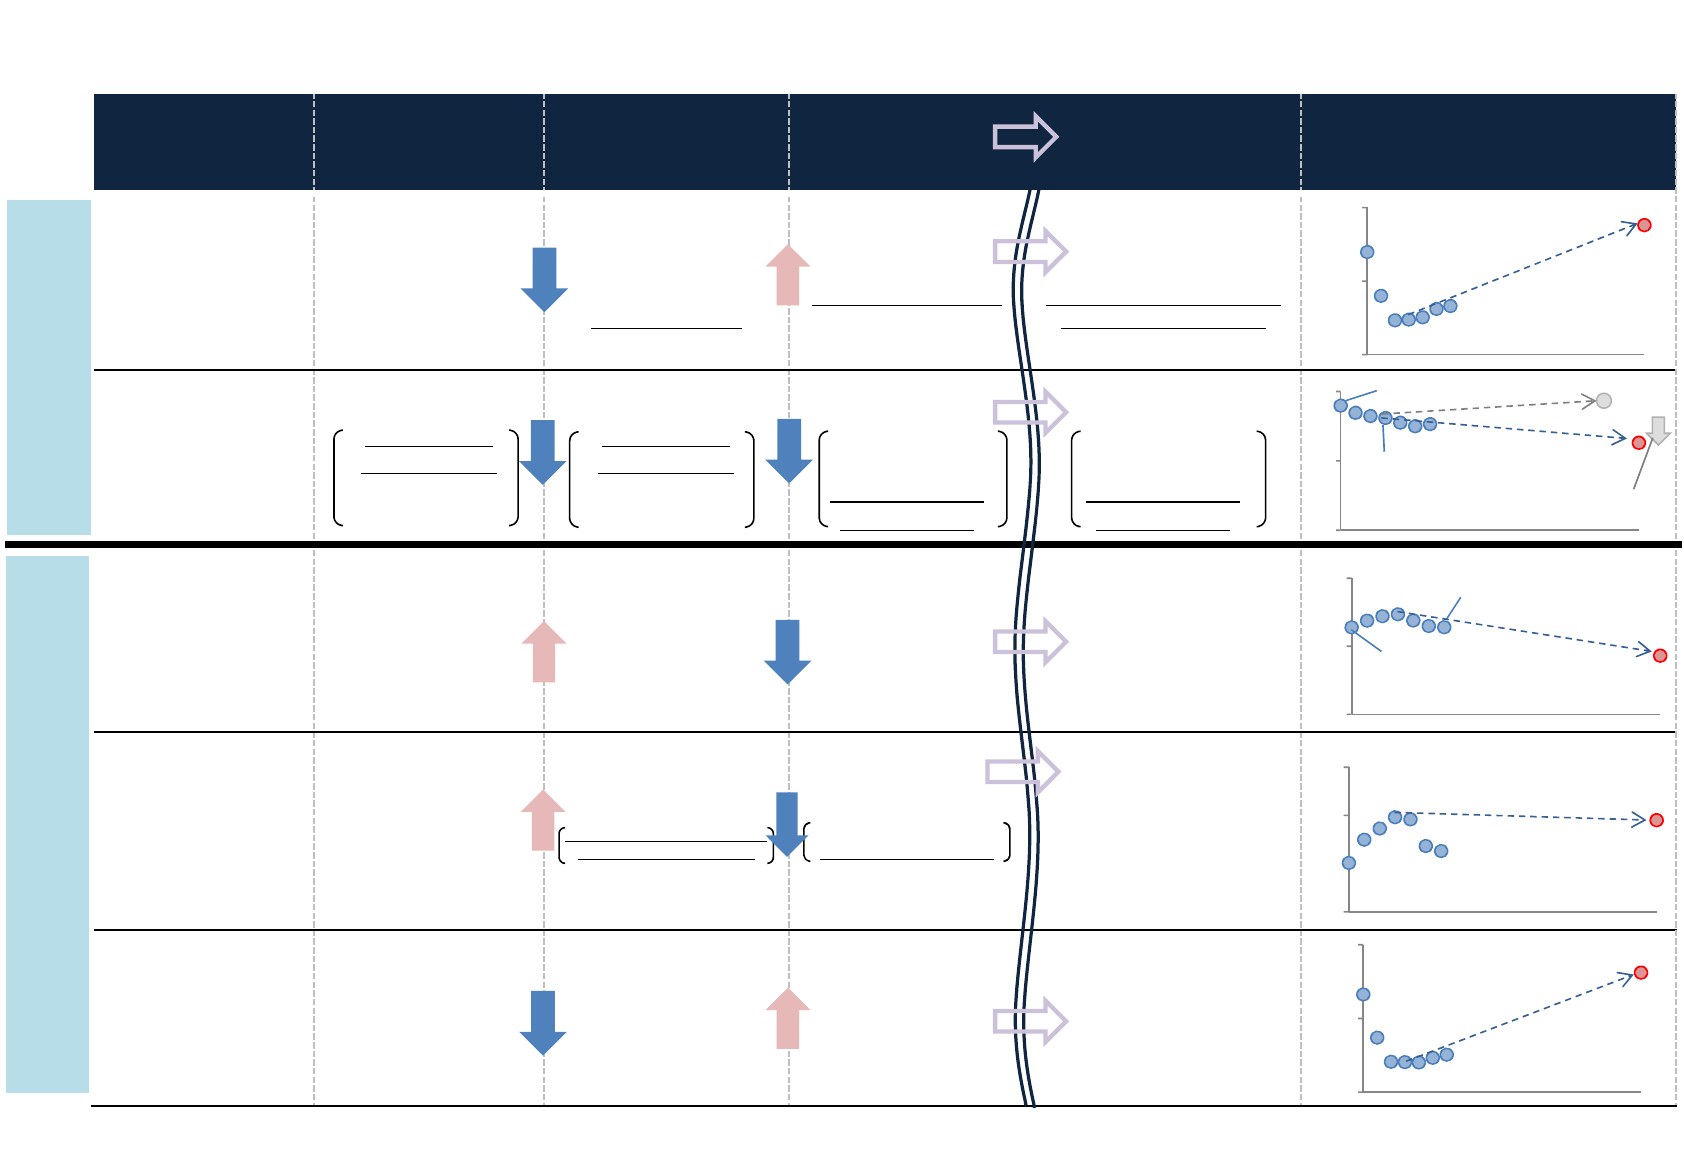
(i) Cost
(ii) Operating
reserves
(iii) NW
Challenges
Current
Significantly
declined
in foreign countries
Depending on
thermal power as
operating reserves
Constructed in
accordance with the
locations of thermal
and nuclear power
plants
Reduce higher cost
in Japan
Maintain thermal
power as operating
reserves
+
Reduce battery cost
Restructure NW
suitable for
renewable energy
+
Introduce
distributed NW
Referred example “Clean energy’s dirty secret - Wind and solar power disrupting electricity systems”
Economist, Feb 25th 2017
7
Three challenges to be addressed for renewable energy to be a major power source

2010 2016
Percentage of
Renewable Energy
14% 29%
Utilization Ratio of
Gas-fired Power Plant
43% 32%
Average Spot Price
€/MWh
44€ 29€
Fluctuation Range of
Spot Price
(Variation Coefficient: σ/Average)
31% 43%
Dissemination of renewable energy with no marginal cost has
decreased the capacity utilization of thermal power plants,
which leads to declining profitability of large-scale power sources.
Fluctuations in spot prices have reduced predictability in investment.
Profitability
worsened.
↓
New investment in
power sources has
become more
difficult.
↑
▲11%
+15%
▲15€
Germany
※2010 and 2016 crude oil prices (WTI) at $79/bbl, $43/bbl respectively
Source: Created by Agency for Natural Resources and Energy from ENTSO-E, AG Energiebilanzen, etc.
×→
+12%
Larger fluctuations
have reduced
predictability and
increased risk
premiums.
Risk of
future
price
upsurge
8

Contributions to Climate Change
Our nationally determined contributions towards post-2020 GHG emission reduction is at the level of a
reduction of 26.0% in FY 2030 compared to FY 2013
Japan’s GHG emission share accounts for only 2.7%. It’s important to contribute to the reduction of GHG
emission in the world or developing countries.
[Intended Nationally Determined Contributions submitted by major countries]
Compared with
1990
Compared with
2005
Compared with
2013
Japan -18.0% (2030) -25.4% (2030) -26.0% (2030)
U.S.
-14 to 16%
(2025)
-26 to 28%
(2025)
-18 to 21%
(2025)
EU -40% (2030)
-35% (2030) -24% (2030)
China
-60% to -65% of carbon dioxide emissions per unit
of GDP by 2030 compared to 2005
achieve the peaking of carbon dioxide emissions
around 2030
South
Korea
+81% (2030) -4% (2030) -22% (2030)
The U.S. submitted emission reduction target compared to 2005 while the EU submitted its target compared to 1990.
South Korea submitted an emission reduction target of -37% in 2030 compared to the business-as-usual (BAU) scenario.
GHG emission share
(※)︓The list of countries which are obliged to reduce GHG emission
【Source】CO2 EMISSIONS FROM FUEL COMBUSTION2016(IEA)
China
23.2%(114.6)
USA
13.6%(67.3)
EU‐28
10.0%(49.5)
India
5.1%(25.1)
Russia
5.1%(25.1)
Indonesia
3.8%(18.9)
Brazil
3.2%(16.1)
Japan
2.7%(13.4)
Congo
2.3%(11.1)
Canada
1.5%(7.3)
Iran
1.4%(7.1)
Korea
1.3%(6.6)
Other
AnnexI
3.6%(17.9)
OtherNon‐
AnnexⅠ
23.1%(114.0)
AnnexⅠ(※)
37%
Non-AnnexⅠ
63%
9

Issei Nishikawa Governor,FukuiPrefecture
Hiroya Masuda
NomuraResearchInstitute,LtdAdviserTHEUNIVERSITY
OFTOKYOVisitingProfessor
ToshihiroMatsumura
Professor,InstituteofSocialScience,TheUniversityofTokyo
NobukoMizumoto
ManagingExecutiveOfficer&GeneralManager,
ProcurementStrategyPlanning,IHICorporation
Hirotaka Yamauchi
Professor,Hitotsubashi University,GraduateSchoolof
CommerceandManagement
AkiraYamaguchi
Professor,TheUniversityofTokyo,DepartmentofNuclearEngineering
Member of Round Table for Studying Energy Situations
Member of the Strategic Policy Committee of the Advisory
Committee for Natural Resources and Energy
“The Strategic Policy Committee of the Advisory Committee for Natural
Resources and Energy” & “Round Table for Studying Energy Situations”
Periodic review of the plan is necessary and as four years have passed since the formulation of the
Strategic Energy Plan, the Strategic Policy Committee of the Advisory Committee for Natural Resources
and Energy held the 1
st
meeting on August 9, 2017 to begin those discussions.
Under the Plan for Global Warming Countermeasures based on the Paris Agreement, Japan decided to
aim at achieving an 80% reduction by 2050 as a long-term goal. However, such an ambitious goal may
be difficult to achieve if we only continue current efforts. To overcome this challenge, Japan needs to
achieve technological innovations and reduce carbon emissions through international contributions.
To this end, METI established a Round Table for Studying Energy Situations.
MasamiIijima ChairmanoftheBoardofDirectors,Mitsui&Co.,Ltd.
JunkoEdahiro
Professor,TokyoCityUniversity
FounderandPresident,e’sInc.
MakotoGonokami President,TheUniversityofTokyo
MasahiroSakane Councilor,Komatsu,Ltd.
TakashiShiraishi
President,InstituteofDevelopingEconomies,
JapanExternalTradeOrganization
HiroakiNakanishi ExecutiveChairman,Hitachi,Ltd.
YoichiFunabashi Co‐founderandChairman,Asia PacificInitiative
NaokoYamazaki Astronaut
MasahiroSakane Councilor,KomatsuLtd.
Keigo Akimoto
GroupLeader,SystemsAnalysisGroup,ResearchInstitute
ofInnovativeTechnologyfortheEarth(RITE)
Mami Ito
President&CEO,NIHONDENTOKOUGYOCo.,Ltd.
TakaoKashiwagi InstituteProfessor,TokyoInstituteofTechnology
TakeoKikkawa
Professor,GraduateSchoolofInnovationStudies,Tokyo
UniversityofScience
Teiko Kudo
ManagingExecutiveOfficer,SumitomoMitsuiBanking
Corporation
YukoSakita
Journalist/Environmentalcounselor,Representof
NPO"GENKINetworkforCreatingaSustainableSociety"
YokoTakeda
ChiefEconomist DeputyGeneralManagerResearch
CenterForPolicyAndEconomy
KikukoTatsumi
StandingAdvisor,NIPPONASSOCIATIONofCONSUMER
SPECIALISTS(NACS) PublicInterestIncorporated
Association
Jitsuro Terashima Chairman,JapanResearchInstitute,Chairman
MasakazuToyoda
ChairmanandCEOTheInstituteofEnergyEconomics,Japan
HidetoshiNakagami Jyukankyo ResearchInstituteInc.CEOandFounder
10
Before the Great East
Japan Earthquake
(FY2010)
After the Great East
Japan Earthquake
(FY2013)
Current
(FY2016: estimation)
Energy Mix
(FY2030)
Progress
[i] Ratio of
zero-emission
power source
36 %
Renewable energy: 10%
Nuclear power: 26%
12 %
Renewable energy: 11%
Nuclear power: 1%
17 %
Renewable energy: 15%
Nuclear power: 2%
44 %
Renewable energy: 22 to 24%
Nuclear power: 22 to 20%
[ii] Energy
conservation
(Final energy
consumption in
crude-oil equivalents)
380 million kl
Industries and
businesses: 2.4
Households: 0.6
Transport: 0.8
360 million kl
Industries and
businesses: 2.3
Households: 0.5
Transport: 0.8
350 million kl
Industries and
businesses: 2.2
Households: 0.5
Transport: 0.8
330 million kl
Industries and
businesses: 2.3
Households: 0.4
Transport: 0.6
[iii]
CO2 emissions
amount
(energy-oriented)
1.13 billion ton 1.24 billion ton 1.14 billion ton 0.93 billion ton
[iv] Power cost
(fuel cost +
FIT purchase cost)
5 trillion yen
Fuel cost: 5 trillion yen
(Crude-oil price: $84/bbl)
FIT purchase:
0 trillion yen
9.8 trillion yen
Fuel cost: 9.2 trillion yen
(Crude-oil price: $110/bbl)
Quantum factor + 1.6 trillion yen
Price factor + 2.7 trillion yen
FIT purchase:
0.6 trillion yen
6.2 trillion yen
Fuel cost: 4.2 trillion yen
(Crude-oil price: $48/bbl)
Quantum factor - 0.9 trillion yen
Price factor - 4.1 trillion yen
FIT purchase:
2.0 trillion yen
9.2 to 9.5 trillion yen
Fuel cost: 5.3 trillion yen
(Crude-oil price: $128/bbl)
FIT purchase:
3.7-4.0 trillion yen
[v] Energy self-
sufficiency rate
(overall primary energy)
20 % 6 % 8 % 24 %
Progress in the Energy Mix Policy by FY2030
- Steady advancement seen while half way through -
0%
25%
50%
2
3
4
5
10
15
0
5
10
15
0%
15%
30%
FY2030
FY2016
FY2010
* Figures in FY2016 are the results estimated based on the data in the Energy Supply-Demand Outlook in Japan by FY2018
(prepared by the Institute of Energy Economics, Japan).
* The power cost in FY2030 includes 0.1 trillion yen as a cost for stable power grids.
Source: Prepared by ANRE based on the data in the Comprehensive Energy Statistics, etc.
Effort indices
Achievement indices
FY2010
FY2016
FY2030
FY2016
Thorough energy
conservation
FY2013
(at the time of
formulating the policy)
Economic growth rate: 1.7% / yearFY2010
FY2010
FY2016
FY2030
FY2030
FY2016
FY2010
11

12
<Position>
…Nuclear power is an important base-load power source
as a low carbon and quasi-domestic energy source,
contributing to stability of energy supply-demand
structure, on the major premise of ensuring of its safety, …
<Policy Direction>
…Dependency on nuclear power generation will be lowered
to the extent possible by energy saving and introducing
renewable energy as well as improving the efficiency of
thermal power generation, etc.…
(quoted from Strategic Energy Plan 2014)
Position of nuclear energy in the primary energy structure and its policy direction

Nuclear Power Plants in Japan
Tokyo EPCO
Fukushima Daiicih
Hokkaido EPCO
Tomari
Tohoku EPCO
Onagawa
Chubu EPCO
Hamaoka
JAPC
Tokai/Tokai Daini
Tokyo EPCO
Kashiwazaki Kariwa
Kyushu EPCO
Sendai
Chugoku EPCO
Shimane
Hokuriku EPCO
Shika
JAPC
Tsuruga
Kansai EPCO
Takahama
Kansai EPCO
Mihama
Tohoku EPCO
Higashidori
Tokyo EPCO
Higashidori
Kyushu EPCO
Genkai
Kansai EPCO
Ohi
Tokyo EPCO
Fukushima Daini
J-POWER
Ohma
110
35
110
34
110
32
110
30
138
13
52
33
83
16
139
1107878787846
17
8454
110
32
110
27
110
24
110
23
110
27
89
33
56
37
137
83
41
54
24
36
34 50
56
46
118
24
118
20
83
43
83
42
89
32
110
29
PWR BWR
ABWR
Capacity(10MkW)
Age
12 reactors
Under NRA
Review
As of 3
rd
, Apr, 2018
Shikoku EPCO
Ikata
57 89
23
7 reactors
In Operation
18 reactors
already decided to
Decommission
136
21
136
20
58
28
58
26
91
8
121
12
116
31
118
26
118
25
82
29
110
30
110
39
83
22
110
12
138
114
24
87
33
87
32
7 reactors
Passed NRA Review
for the Permission for Changes
in Reactor Installation
*Ikata Unit 3 and Sendai Unit 1 are under the periodic inspection. Genkai Unit 3 is under the pre-service inspection
118 118
57

Nuclear Energy
- Restarting nuclear power plants with safe as the top priority, contributing to reducing
CO2 emissions and mitigating burden of increased renewable energy cost -
<Restoration from damage
caused by the accident and
reconstruction of Fukushima>
• Sincerely reflecting upon the
accident in Fukushima Prefecture
• The government of Japan intends
to proactively lead efforts for
decommissioning, addressing
contaminated water and
reconstruction of Fukushima.
<Improving safety>
• Formulated the world’s strictest-
level new regulatory requirements;
strict examinations by the Nuclear
Regulation Authority
• Establishing a system for improving
continuous and autonomous safety
<Enhancing disaster prevention>
• Providing a backup system in
formulating evaluation plans in
collaboration among the government
and related organizations
• Enhancing disaster prevention in
collaboration among related
organizations, e.g., operational units,
and nuclear operators
<Final disposal and interim storage>
• Publicizing the Nationwide Map of
Scientific Features for Geological
Disposal under the leadership of the
government, and fostering public
understanding of these issues
• Enhancing efforts for expanding
interim-storage capacity of spent fuels
in public-private collaboration
Greatest challenge in the nuclear power field: Recovering social trust
• Securing personnel with advanced skills, advancing technological development, and promoting
investment as necessary measures for restarting and decommissioning of nuclear power plants with
safety as the top priority
Securing technologies and human resources
Target share of nuclear power in all power sources
in FY2030: 20-22%
Impacts caused by restarting units
Operation of one unit:
Reduction of fuel cost → 35.0-63.0 billion yen/year*
Reduction of CO2 emissions
→ 2.60 million - 4.90 million tons/year*
(Total CO2 emissions per year in Japan: Approx. 1.1 billion tons)
* These figures are estimated values (FY2016) in the case where a 1 million kW-level nuclear power plant
(with the operation rate of 80%) is operated by LNG or oil-fired thermal power in the place of nuclear power.
• 7 units: Restarted on the premise of secured safety
• 7 units: Permissions for Changes in Reactor
Installation granted
• 12 units: Under examination according to the new
regulatory requirements
14

The Strategies of Major Countries for 2050
United
States
Canada
France
United
Kingdom
*
Germany
* Not yet submitted to UNFCCC as long-term strategy. Created from The Clean Growth Strategy (November 2017).
Reduction
Target
Flexibility
Main Strategy, Posture
▲80% or
more
(as percentage of
2005)
▲80%
(as percentage
of 2005)
▲80~95%
(as percentage of
1990)
▲75%
(as percentage
of 1990)
▲80% or
more
(as percentage of
1990)
Ambitious vision towards reduction target
(not intended as current policy proposals)
Informing the conversation
(not a blue print for action)
Point to the direction towards
reducing emissions
(not a search for masterplan)
Possible path for achieving objectives
(not an action plan)
Helps players identify steps to take in the next few
years by exploring potential pathways
(long-term predictions are difficult)
providing an ambitious vision to reduce net GHG
emissions by 80 percent or more below 2005 levels by
2050.
not a blue print for action. Rather, the report is meant to
inform the conversation about how Canada can achieve
a low-carbon economy.
not a rigid instrument; it points to the direction
needed to achieve a greenhouse gas-neutral economy.
the scenario is not an action plan: it rather presents a
possible path for achieving our objectives.
exploring the plausible potential pathways to 2050 helps us
to identify low-regrets steps we can take in the next few
years common to many versions of the future
※Conduct regular reviews
Energy Conservation
/Electrification
Zero Emission Overseas
Variable renewable
energy
+
Nuclear power
Large-scale
electrification
(20%→45~60%)
Contribution
through
expanding
market for US
products
Hydro power・
Variable renewables
+
Nuclear power
Large-scale
electrification
(20%→40~70%)
Looking to
contribute
internationally
(0~15%)
Increase
Securing the
electricity
Approx. 80% of electricity
source already zero emission
Renewable
energy
+
Nuclear power
Large-scale energy
conservation
(half as percentage of 1990)
Contribution through
international
development support by
French businesses
Securing the
electricity
※Zero emission rate already at more than
90%
Variable
renewables
+
Nuclear power
Increase
Promote energy
conservation/elect
rification
Lead the world
through
environmental
investment
Variable
renewable
energy
Increase
Maintaining
and bolstering
investment
sentiment in
LDCs
Large-scale
energy
conservation
(half as percentage of 1990)
15

・Turkey
・Belarus
・Chile
・Egypt
・Indonesia
・Israel
・Jordan
・Kazakhstan
・Malaysia
・Poland
・Saudi Arabia
・Thailand
・Bangladesh
・UAE
Not using Nuclear Power
Now using Nuclear Power
Use nuclear power in the future
Abandon nuclear power in the future
・
United States [99]
・
France [58]
・
China [37]
・
Russia [35]
・
India [22]
・
Canada [19]
・
Ukraine [15]
・
United Kingdom [15]
・
Sweden [8]
・
Czech [6]
・
Pakistan [5]
・
Finland [4]
・
Hungary [4]
・
Argentina [3]
・
South Africa [2]
・
Brazil [2]
・
Bulgaria [2]
・
Mexico [2]
・
Netherlands [1]
・South Korea* [24] (by cabinet decision 2017, closing expected after 2080)
・Germany [8] (by legislation in 2011, to be closed in 2022)
・Belgium [7] (by legislation in 2003, to be closed in 2025)
・Taiwan [6] (by legislation in 2017, to be closed in 2025)
・Switzerland** [5] (by legislation 2017, closing TBD)
・Italy (by cabinet decision 1988, closed down in 1990)
・Austria (by legislation 1979)
・Australia(by legislation 1998)
(year nuclear power generation closing determined/year scheduled for closedown)
*In South Korea, 5 reactors are under construction.
(2 of them are decided to continue after deliberative polling)
**In Switzerland, there is not placed a limit on years in operation.
Source: Created by Agency for Natural Resources and Energy from
World Nuclear Association website (viewed August 1, 2017)
Note: Only major countries are listed.
[]: units in operation
[] indicates number of units in operation
・ There are also many countries that have not
clarified their stance
16
Four Countries decided to phase out Nuclear Power after Fukushima Accident.
Many other Countries are choosing Nuclear Power for Carbon Reduction and other Reasons.

After the nuclear
accident in
Fukushima (2012)
%%
Opponents:
50% to 60%
2013
* No survey by Sankei
Shim
bun since 2015
%%
Supporters:
20% to 40%
〇How do public opinions concerning nuclear power differ by country?
2014 2015 2016
* No survey by Nikkei
Shim
bun since 2016
2017
17
20%
30%
40%
50%
60%
70%
⽇経
朝⽇
読売
毎⽇
産経
Nikkei
Asahi
Yomiuri
Mainichi
Sankei
Regarding resumption of operations of nuclear power plants, opponents outnumber
supporters two to one. In Japan, the restoration of public trust is the biggest challenge.

CO2 Emissions by sector and corresponding mitigation technologies
18
Source: Agency for Natural Resources and Energy
Industry
(310 Mt)
Buildings
(120 Mt)
Transport
(210 Mt)
Power
generation
(510 Mt)
Present Future
Oil, coal, and natural gas
CCUS and hydrogen power
generation etc.
Generation Ⅲ+ reactor Next-generation reactor
Challenges of installation
(Costs for installation flexibility, grid systems, etc.)
Power storage
x
Innovation in grid system
Internal-combustion engine, manual driving
Metal car body
Electrification, automated driving
Multi materials
Fossil fuel
Electricity/Hydrogen
Biofuel
Oil, gas, and electricity
Electricity, hydrogen, etc.
High-efficiency devices
Devices supporting the IoT
M2M control
Development in smart technologies
CCUS/Hydrogen reduction
Further development of smart
technologies
Fossil energy materials
Non-fossil energy materials
Thermal
Nuclear
Renewable
energy
Vehicle
Body/System
Fuel
Heat
source
Process
Product
Main factors
Device
* The figures inside ( ) are the amounts of CO2 emissions in FY 2015.
Hydrogen (Supply Chain and Methanation)
Innovation
