
Engineering & Operations Committee
February 22nd, 2024
Quarterly Service Performance Review
2nd Quarter, FY24 (October- December 2023)

Page | 1
SAN FRANCISCO BAY AREA RAPID TRANSIT
Customer Experience
Customer Service
• Customer Service
• Overall Customer Satisfaction
• Station Agent Customer Service
• Complaints
Environment
• Environment – Stations
• Outside
• Inside
• Environment – Trains
• Cleanliness
• Temperature
• Environment – Code of Conduct
• Gender Based Harassment
• Fare Evasion
KPI Grouping
Service Performance
Railway Asset Availability
Revenue Fleet
• Revenue Fleet - Fleet Reliability
• 4 AM - Car Availability
• Vehicle MTBSD - (Hours)
Wayside
• Wayside - Train Control Systems
• Wayside Train Control System
• Control System
• Wayside - Railway Systems
• Track
• Traction Power
Operations
• Transportation Staffing
Stations
• Availability – Elevators
• Availability – Escalators
• Availability – Fare Collection
Safety and Security
Safety
• Safety – Passenger
• Station Incidents
• Vehicle Incidents
• Safety – Employee
• Lost Time Injuries
• OSHA Recordable Injuries
• Safety – Violations
• Unscheduled Door Openings
• OSHA Recordable Injuries
Security
• Police Coverage
• BPD Presence
• BPD Response Time
• Crime – Against Person
• Crime – Burglary
• Bike Thefts
• Auto Burglaries
• Auto Thefts
• Progressive Policing
Category Class Slide
Page | 1
SAN FRANCISCO BAY AREA RAPID TRANSIT
Service Delivery
Capacity
• Weekday - Average Ridership
• Dispatches Operated
• Passenger Loading
Punctuality
• On-time – Customer
• Daily / Peak
• On-time – Train
• Daily / Peak
• Timed Train Meets - K-Line
Page | 2
SAN FRANCISCO BAY AREA RAPID TRANSIT
Summary – Service Delivery
Metric
FY24 Q2 Goal
Change from
FY24 Q1
Weekday
- Average Ridership
160474 164933 (2.50%)
▼
Trains On
-Time - Daily
76.3% 91.0% (8.97%)
▼
Customers On
-Time - Daily
90.4% 94.0% (1.81%)
▼
Trains On
-Time - Peak
76.5% (8.37%)
▼
Customers On
-Time - Peak
89.8% (2.47%)
▼
All-Day
Peak
67%
33%
Goal Met
Goal Not Met <5%
Goal Not Met >5%
▼
Gray arrows represent change from the previous quarter for metrics which do not have an established goal

Page | 3
SAN FRANCISCO BAY AREA RAPID TRANSIT
6333
4621
7364
3180
4345
3135
3403
3131
2369
3153
4975
7095
0
1000
2000
3000
4000
5000
6000
7000
8000
Jan Feb Mar Apr May Jun Jul Aug Sep Oct Nov Dec
Service Delivery – Delay Incident Detail
15223 Delayed Trains
Caused by Incidents
Trains Delayed - Top Ten Single Incidents
Trains Delayed by Month
Top ten incidents =
39.4% of delayed trains
Service Delivery – Delay Incident Detail
FY23 Q3 FY23 Q4 FY24 Q1 FY24 Q2
Cancellations
0%
State of
Good
Repair
10%
Other
70%
Societal
20%
11%
15%
74%
Operations
Vehicle
Wayside
31%
69%
Intrusion
Police
and
Security
7%
93%
Car
Shortage
Staffing
Shortage
2%
3%
7%
88%
Congestion
Miscellaneous
Passenger
Weather
12/18/2023, Weather (Rain), 842
12/29/2023, Weather (Rain), 739
12/20/2023, Weather (Rain), 682
12/19/2023, Weather (Rain), 660
11/15/2023, Weather (Rain), 605
10/22/2023, Weather (Rain), 521
12/27/2023, Weather (Rain), 518
11/16/2023, Weather (Rain), 502
11/18/2023, Weather (Rain), 499
12/17/2023, Weather (Rain), 431

Page | 4
SAN FRANCISCO BAY AREA RAPID TRANSIT
K
50K
100K
150K
200K
250K
Oct Nov Dec Jan Feb Mar April May June July Aug Sept Oct Nov Dec
Average Weekday Trips
Results Goal
Capacity – Ridership
• Total Ridership up 9.2% over last year.
• Average weekday ridership up 9.8% over last year.
• Saturday ridership up 11.8% over last year.
• Sunday ridership up 7.8% over last year.
Average Ridership - Weekday
Comparison of December Ridership by Day of Week
Weekday Hourly System Activity
61%
35%
42%
41%
40%
36%
54%
K
100K
200K
300K
400K
500K
Sun Mon Tue Wed Thu Fri Sat
Dec-23 Dec-19
K
5K
10K
15K
20K
25K
30K
35K
40K
45K
50K
6 A.M. noon 6 P.M. Midnight
April 2020
Pre-COVID 2019
December 2023
November 2023
●

Page | 5
SAN FRANCISCO BAY AREA RAPID TRANSIT
88%
90%
92%
94%
96%
98%
100%
Oct Nov Dec Jan Feb Mar Apr May Jun Jul Aug Sep Oct Nov Dec
% of Operated Trips
Capacity – Dispatches Operated
Scheduled Runs Dispatched from Origin
% of Scheduled Dispatches Missed by Cause
Hourly Scheduled Runs Dispatched from Origin
• Cancellations improved to 1% of trains missing dispatch
from origin
Runs dispatched
Missed dispatches
97%
98%
99%
100%
5 6 7 8 9 10 11 12 13 14 15 16 17 18 19 20 21 22 23 24
% of Operated Trips
Weekday Weekend
0.0%
0.5%
1.0%
1.5%
2.0%
2.5%
3.0%
3.5%
4.0%
Jan Feb Mar Apr May Jun Jul Aug Sep Oct Nov Dec
Weather
Major Incidents
Car Shortage
Staffing Shortage
Undertermined
Cause
Page | 6
SAN FRANCISCO BAY AREA RAPID TRANSIT
0
10
20
30
40
50
60
1 2 4 5 6 7 8 9 10 11 12 13 14 15 16 17 18 19 20 21 22 23 24
Blue
Green
Orange
Red
Yellow
BART Line Color
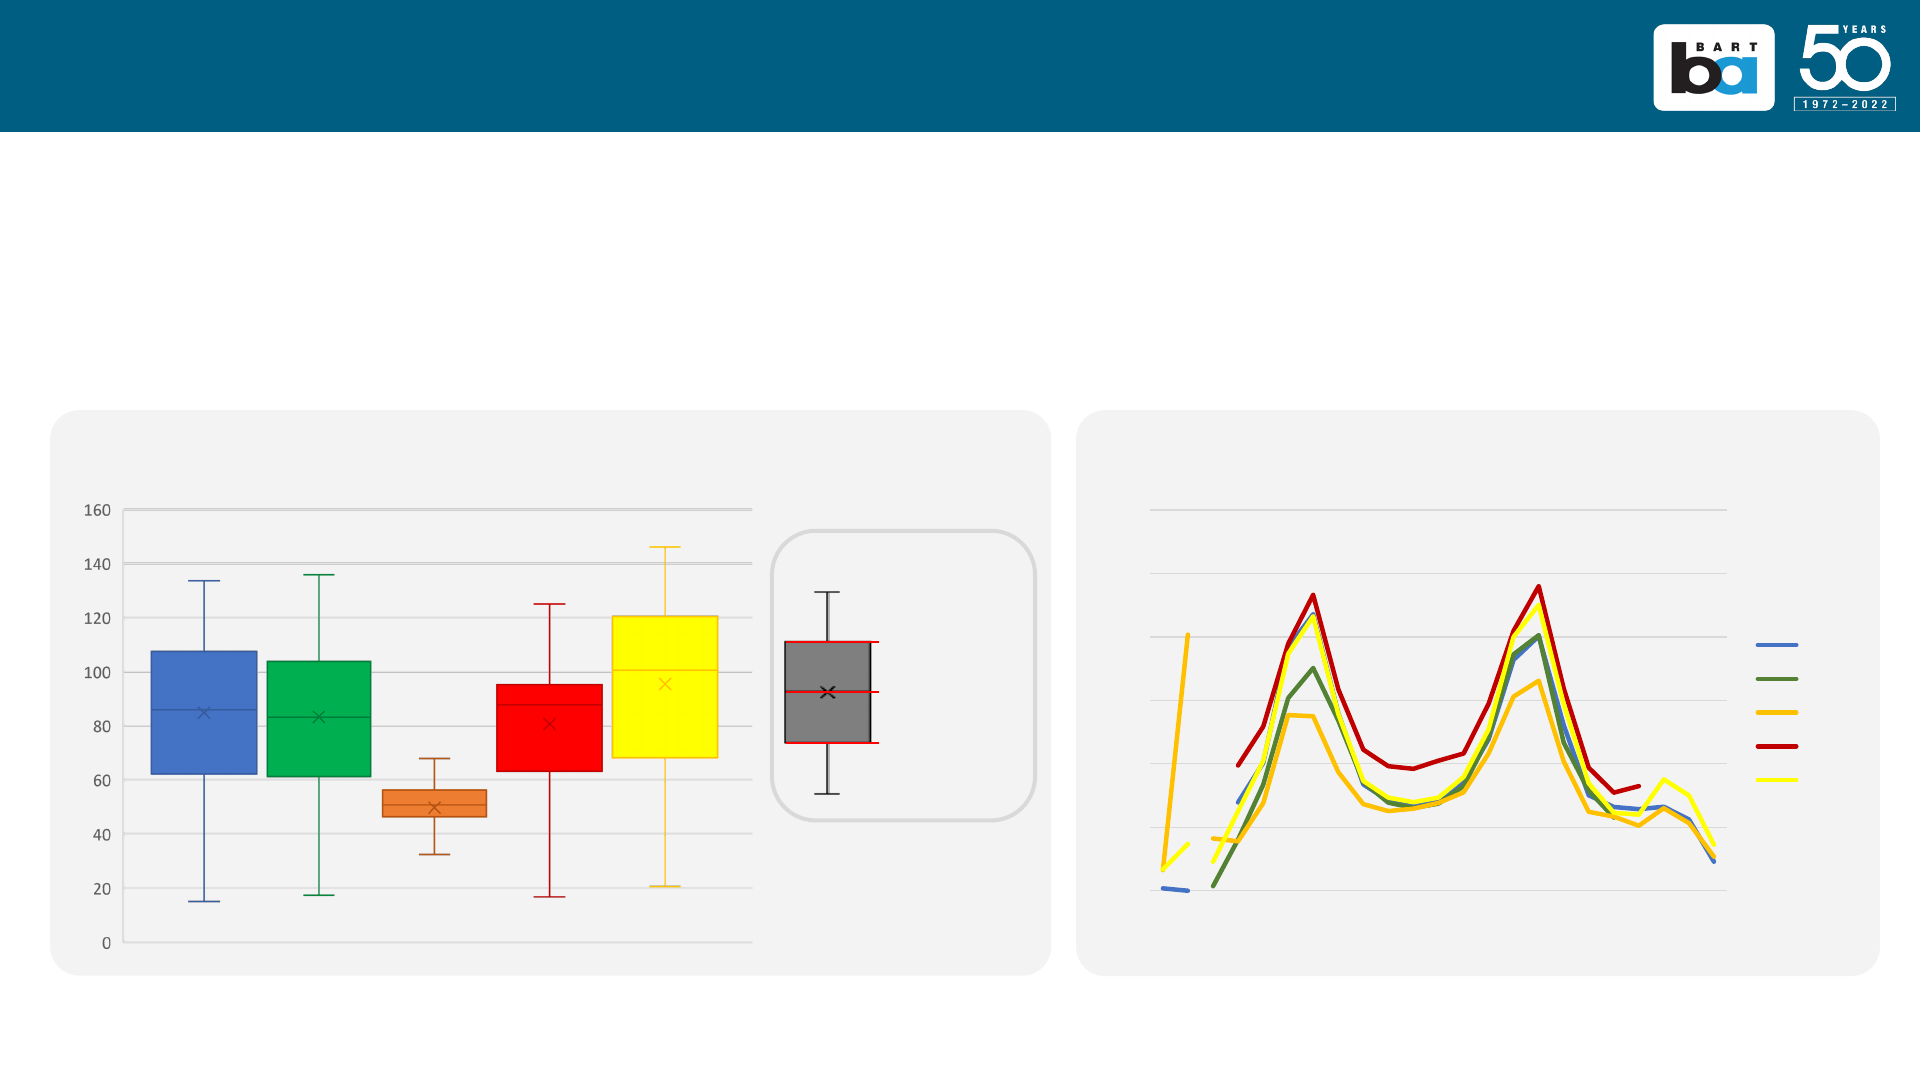
Capacity – Passenger Loading
Passenger Load per Car for Top 5 Crowded Weekday Trains
Passenger Load per Car
Minimum of Top 5*
Maximum of Top 5*
75
th
Percentile
25
th
Percentile
Median
Legend
*Maximum & Minimum
Values of Top 5 Crowded
Trains with outliers
removed
Passenger Load per Car
Time of Day
1
Typical Busiest Trains by Route
XX
1
Average Hourly Weekday Passenger Load per Car by Line
120
95
56
107
103

Page | 7
SAN FRANCISCO BAY AREA RAPID TRANSIT
40%
50%
60%
70%
80%
90%
100%
Oct Nov Dec Jan Feb Mar April May June July Aug Sept Oct Nov Dec
Daily TOT Goal
Punctuality – Trains On-Time
Percent of Delayed Trains by Incident Cause (EOL)
Trains On-Time - Daily Trains On-Time - Peak
●
40%
50%
60%
70%
80%
90%
100%
Oct Nov Dec Jan Feb Mar April May June July Aug Sept Oct Nov Dec

Page | 8
SAN FRANCISCO BAY AREA RAPID TRANSIT
50%
60%
70%
80%
90%
100%
Oct Nov Dec Jan Feb Mar April May June July Aug Sept Oct Nov Dec
Daily POT Goal
Customer On-Time - PeakCustomer On-Time - Daily
• Customer On-Time was 90.4% for the quarter.
Punctuality – Customer On-Time
50%
60%
70%
80%
90%
100%
Oct Nov Dec Jan Feb Mar April May June July Aug Sept Oct Nov Dec
●

Page | 9
SAN FRANCISCO BAY AREA RAPID TRANSIT
Southbound Meets at MacArthur
Northbound Meets at 19
th
Street
• A meet is considered successful when there is at least 20 seconds of overlap time for both trains at the timed
transfer point
• Timed Train Meets on the K-Line between the Yellow and Orange lines occur as follows
• Northbound trains meet at 19
th
Street
• Southbound trains meet at MacArthur
Punctuality – Timed Train Meets
10%
25%
40%
55%
70%
85%
100%
Oct Nov Dec Jan Feb Mar Apr May Jun July Aug Sept Oct Nov Dec
% Met N/B Weekday % Met N/B Weekend Train On-Time
10%
25%
40%
55%
70%
85%
100%
Oct Nov Dec Jan Feb Mar Apr May Jun July Aug Sept Oct Nov Dec
% Met S/B Weekday % Met S/B Weekend Train On-Time

Page | 10
SAN FRANCISCO BAY AREA RAPID TRANSIT
Summary – Railway Asset Availability
Metric
FY24 Q2 Goal
Change from
FY24 Q1
Track
0.45 0.30 48.48%
▲
Traction Power
0.38 1.00 66.07%
▲
Wayside Train Control System
1.02 1.30 15.74%
▲
Computer Control System
0.04 0.30 86.59%
▲
Transportation
0.36 0.50 36.62%
▲
Vehicle MTBSD
- (Hours) 19043 9600 49.30%
▲
4 AM
- Car Availability 504 446 (20.89%)
▼
DMU
- MDBF (Miles) 39420 28000 (8.11%)
▼
Elevators in Service
- Station 99.3% 98.0% 0.59%
▲
Elevators in Service
- Garage 99.8% 97.0% 0.11%
▲
Escalators in Service
- Street 96.7% 93.0% (0.80%)
▼
Escalators in Service
- Platform 98.4% 96.0% (0.30%)
▼
Automatic Fare Collection
- Gates 99.5% 98.0% 0.16%
▲
Automatic Fare Collection
- Vendors 99.1% 95.0% 0.03%
▲
Wayside Equipment
Revenue Vehicle
Station Equipment
93%
7%
Goal Met
Goal Not Met <5%
Goal Not Met >5%

Page | 11
SAN FRANCISCO BAY AREA RAPID TRANSIT
0 100 200 300 400 500 600
Train Control System
Track System
Traction Power System
Maintenance Procedure
Station ATO
Smoke/Fire
Computer Control System
Wayside Asset Availability – Detail
• 1146 Train delays for the quarter
• Track had multiple rail defects that required slow
orders
• Train Control experienced multiple switch
failures and a false occupancy

Page | 12
SAN FRANCISCO BAY AREA RAPID TRANSIT
0.00
0.15
0.30
0.45
0.60
0.75
0.90
1.05
1.20
Oct Nov Dec Jan Feb Mar April May June July Aug Sept Oct Nov Dec
Delayed Trains per 100 Train
Trips
Results Goal
0.00
0.50
1.00
1.50
2.00
2.50
Oct Nov Dec Jan Feb Mar April May June July Aug Sept Oct Nov Dec
Delayed Trains per 100 Train
Trips
Results Goal
Wayside Equipment – Delayed Trains by System
Wayside Computer Control SystemTraction Power System
Track System Wayside Train Control System
0.00
0.25
0.50
0.75
1.00
1.25
1.50
1.75
Oct Nov Dec Jan Feb Mar Apr May Jun July Aug Sept Oct Nov Dec
Delayed Trains per 100 Train
Trips
Results Goal
●
●
●
●
●
●
0.00
0.60
1.20
1.80
2.40
3.00
Oct Nov Dec Jan Feb Mar April May June July Aug Sept Oct Nov Dec
Delayed Trains per 100 Train
Trips
Results Goal

Page | 13
SAN FRANCISCO BAY AREA RAPID TRANSIT
2,500
7,500
12,500
17,500
22,500
27,500
32,500
Oct Nov Dec Jan Feb Mar April May June July Aug Sept Oct Nov Dec
Meantime Between
Service Delays (Hours)
Results Goal
400
460
520
580
640
700
760
Oct Nov Dec Jan Feb Mar April May June July Aug Sept Oct Nov Dec
Number of Cars
Results Goal
Revenue Fleet – Reliability
Mean Time Between Service Delays
●
Car Availability at 4 AM
●
LEGACY
FOTF
80
656
Car count as of 12/31/2023
Breakdown of Delayed Trains by Vehicle System

Page | 14
SAN FRANCISCO BAY AREA RAPID TRANSIT
0.00
1.00
2.00
3.00
4.00
5.00
6.00
Oct Nov Dec Jan Feb Mar April May June July Aug Sept Oct Nov Dec
Delayed Trains per 100 Train Trips
Results Goal
Operations
• This quarter the objective was achieved and met the
goal
• Increased staffing of Train Operators is
driving delays down
• 40 train delays due to staffing shortage for the quarter
Operations - Transportation
●

Page | 15
SAN FRANCISCO BAY AREA RAPID TRANSIT
404 12
0 50 100 150 200 250 300 350 400 450
Certified Trainees
14 5 6 7
0 5 10 15 20 25 30 35
Certified Controllers Trainees (Cert Phase) Trainees (Classroom Phase) In Pipeline
Target Range: 30 to 35
Target Range: 510 to 530
Hiring Metrics - Priority Positions
Station Agent
Train Operator
Rail Operations Controller
Target Range: 375 to 395
482 30 12
0 50 100 150 200 250 300 350 400 450 500 550
Certified Trainees In Pipeline

Page | 16
SAN FRANCISCO BAY AREA RAPID TRANSIT
94%
95%
96%
97%
98%
99%
100%
Oct Nov Dec Jan Feb Mar April May June July Aug Sept Oct Nov Dec
Results Goal
Garage Elevator
Station Elevator
●
●
Station Elevator
• Goal met
Garage Elevator
• Goal met
Station Equipment – Elevator Availability
Availability
*E-line Elevator and Escalator are included
94%
95%
96%
97%
98%
99%
100%
Oct Nov Dec Jan Feb Mar April May June July Aug Sept Oct Nov Dec
Availability
Active Goal

Page | 17
SAN FRANCISCO BAY AREA RAPID TRANSIT
80%
82%
84%
86%
88%
90%
92%
94%
96%
98%
100%
Oct Nov Dec Jan Feb Mar April May June July Aug Sept Oct Nov Dec
Results Goal
80%
82%
84%
86%
88%
90%
92%
94%
96%
98%
100%
Oct Nov Dec Jan Feb Mar April May June July Aug Sept Oct Nov Dec
Availability
Results Goal
Platform Escalator
Street Escalator
●
Street Escalator
• Goal met
Platform Escalator
• Goal met
Station Equipment – Escalator Availability
Availability
●

Page | 18
SAN FRANCISCO BAY AREA RAPID TRANSIT
90%
92%
94%
96%
98%
100%
Oct Nov Dec Jan Feb Mar April May June July Aug Sept Oct Nov Dec
Results Goal
90%
92%
94%
96%
98%
100%
Oct Nov Dec Jan Feb Mar April May June July Aug Sept Oct Nov Dec
Results Goal
Vendor Availability
Gate Availability
●
Gate Availability
• Goal met
Vendor Availability
• Goal met
Station Equipment – Automated Fare Collection
Availability
Availability
●

Page | 19
SAN FRANCISCO BAY AREA RAPID TRANSIT
Summary – Customer Experience
Metric
FY24 Q2 Goal
Change from
FY24 Q1
Overall Customer Satisfaction
81% 10%
Station Agent Customer Service
4.4 (2.2%)
Complaints per 100,000 Passenger Trips
26.84 6.45%
Train Temperature
4.31 4.13%
Train Interior Cleanliness
3.71 2.07%
Environment Outside Stations
3.68 5.23%
Environment Inside Stations
3.68 5.15%
Gender Based Harassment
7% (11.11%)
Fare Evasion
22% (7.03%)
Train Environment
Code of Conduct
Station Environment
Customer Experience
▲
Gray arrows represent change from the previous quarter for metrics which do not have an established goal
BART has redesigned the PES surveys
and are currently forming the new
reporting criteria.
The goals will be re-established next
quarter.

Page | 20
SAN FRANCISCO BAY AREA RAPID TRANSIT
Station Agent Customer Service
Overall Customer Satisfaction
Customer Service – Experience
• Station Agent Customer Service is 4.4
• Up 0.5 on the 5-point scale from FY23
Customer service from Station Agent (if used today)
Overall, how satisfied are you with the services provided by BART?
• Overall Customer Satisfaction 81%
• Up by 7% from last quarter
3.9 3.9
4.5
4.4
1
2
3
4
5
FY23 Q3 FY23 Q4 FY24 Q1 FY24 Q2
(Excellent)
(Poor)
Mean
72%
70%
73%
74%
81%
60%
65%
70%
75%
80%
85%
90%
FY23 Q2 FY23 Q3 FY23 Q4 FY24 Q1 FY24 Q2
% of Top-2-box

Page | 21
SAN FRANCISCO BAY AREA RAPID TRANSIT
Customer Service – Cases by Type
Compliment Cases – FY24 Q2Inquiry Cases – FY24 Q2
Breakdown of 6170 Inquiry Cases
0
200
400
600
800
1000
Apps Parking General Clipper Fares/Tickets
0
10
20
30
40
50
Personnel - S/A Service Compliments Misc. Personnel - Other Station Facilities

Page | 22
SAN FRANCISCO BAY AREA RAPID TRANSIT
Customer Service – Complaint Cases
●
Customer Complaints
0
6
12
18
24
30
36
42
48
54
Oct Nov Dec Jan Feb Mar April May June July Aug Sept Oct Nov Dec
Complaints per 100,000
Customers
Results Goal
FY24 Q2 Trending Customer Complaints
Breakdown of Top Five Complaint Categories of 3264 Complaints
0
200
400
600
800
1000
1200
1400
FY23 Q2
FY23 Q3
FY23 Q4
FY24 Q1
FY24 Q2
FY23 Q2
FY23 Q3
FY23 Q4
FY24 Q1
FY24 Q2
FY23 Q2
FY23 Q3
FY23 Q4
FY24 Q1
FY24 Q2
FY23 Q2
FY23 Q3
FY23 Q4
FY24 Q1
FY24 Q2
FY23 Q2
FY23 Q3
FY23 Q4
FY24 Q1
FY24 Q2
Service Police Personnel Maint & Equip Biohazard

Page | 23
SAN FRANCISCO BAY AREA RAPID TRANSIT
Environment Outside Station
• This is a composite score which incorporates the appearance of BART landscaping,
walkways, and entry plaza (67%), and the cleanliness of the parking lot (33%).
Environment Inside Station
• This is a composite score which incorporates the appearance of the platform (40%),
concourse (25%), escalator (10%), stairwells (7.5%), elevator (10%), and restroom (7.5%).
Environment – Stations
Data acquired from PES Survey
(Excellent)
(Poor)
3.5
3.7
3.5
3.7
1
2
3
4
5
FY23 Q3 FY23 Q4 FY24 Q1 FY24 Q2
(Excellent)
(Poor)
Mean
Mean
3.5 3.5 3.5
3.7
1
2
3
4
5
FY23 Q3 FY23 Q4 FY24 Q1 FY24 Q2
Environment Outside Station Environment Inside Station
(Excellent)
(Poor)

Page | 24
SAN FRANCISCO BAY AREA RAPID TRANSIT
• This is a composite score which incorporates the appearance of the train interior
(60%), and the appearance of any graffiti on the train (40%).
Customer Rating – Interior Cleanliness
Customer Rating - Temperature
Environment – Trains
Data acquired from PES Survey
4.1
4.1
4.1
4.3
1
2
3
4
5
FY23 Q3 FY23 Q4 FY24 Q1 FY24 Q2
FOTF
Legacy
Overall
(Excellent)
(Poor)
3.29
3.48
3.57
3.7
1
2
3
4
5
FY23 Q3 FY23 Q4 FY24 Q1 FY24 Q2
FOTF
Legacy
Overall
(Excellent)
(Poor)
Mean
Mean
Customer Rating – Interior Cleanliness Customer Rating - Temperature

Page | 25
SAN FRANCISCO BAY AREA RAPID TRANSIT
0%
5%
10%
15%
20%
25%
30%
FY23 Q2 FY23 Q3 FY23 Q4 FY24 Q1 FY24 Q2
% Answered Yes
Fare Evasion
0%
5%
10%
15%
20%
25%
30%
FY23 Q2 FY23 Q3 FY23 Q4 FY24 Q1 FY24 Q2
% Answered Yes
Gender Based Harassment
Gender Based Harassment Fare Evasion
Environment – Code of Conduct
Data acquired from PES Survey
Did you see anyone enter or exit the Station without paying their fare today?
Have you experienced gender-based sexual harassment at BART in the last six months?

Page | 26
SAN FRANCISCO BAY AREA RAPID TRANSIT
Metric
FY24 Q2 Goal
Change from
FY24 Q1
Vehicle Incidents/Million Patrons
0.25 0.6 (4.16%)
▼
Unscheduled Door Openings/Million Car Miles
0.22 0.2 8.33%
▲
Rule Violations Summary/Million Car Miles
0.22 0.25 (57.14%)
▼
Station Incidents/Million Patrons
1.23 2 (30.85%)
▼
OSHA
-Recordable Injuries/Illnesses/Per OSHA 11.56 12 21.30%
▲
Lost Time Injuries/Illnesses/Per OSHA
6.04 6.5 28.43%
▲
Police Response Time per Emergency Incident
4.80 5 (9.34%)
▼
Bike Thefts
26 100 61.76%
▲
Auto Thefts/1,000 Parking Spaces
3.18 2.25 25.05%
▲
Auto Burglaries/1,000 Parking Spaces
4.22 3.5 8.34%
▲
BART Police Presence
20.3% 12% 16.96%
▲
Crimes Against Persons/Million Riders
12.58 2 (60.12%)
▼
Summary – Safety and Security
Safety
Security
67%
33%
Goal Met
Goal Not Met <5%
Goal Not Met >5%

Page | 27
SAN FRANCISCO BAY AREA RAPID TRANSIT
0.0
0.6
1.2
1.8
2.4
3.0
FY23 Q2 FY23 Q3 FY23 Q4 FY24 Q1 FY24 Q2
Incidents per Million
Passengers
Results Goal
Station Incidents
Vehicle Incidents Station Incidents
●
Vehicle Incidents
Safety – Passenger
0.00
0.30
0.60
0.90
1.20
FY23 Q2 FY23 Q3 FY23 Q4 FY24 Q1 FY24 Q2
Incidents per Million
Passengers
Results Goal
●

Page | 28
SAN FRANCISCO BAY AREA RAPID TRANSIT
0
4
8
12
16
FY23 Q2 FY23 Q3 FY23 Q4 FY24 Q1 FY24 Q2
OSHA-Recordable
Injuries/Illnesses per
OSHA Incidence Rate
Results Goal
Lost Time due to Injuries
OSHA Recordable InjuriesLost Time due to Injuries
OSHA Recordable Injuries
Safety – Employee
0
2
4
6
8
10
FY23 Q2 FY23 Q3 FY23 Q4 FY24 Q1 FY24 Q2
Lost Time Injuries/Illness
per OSHA Rate
Results Goal
●
●

Page | 29
SAN FRANCISCO BAY AREA RAPID TRANSIT
0.0
0.1
0.2
0.3
0.4
FY23 Q2 FY23 Q3 FY23 Q4 FY24 Q1 FY24 Q2
Rule Violations per Million Car Miles
Results Goal
0.0
0.2
0.3
0.5
0.6
FY23 Q2 FY23 Q3 FY23 Q4 FY24 Q1 FY24 Q2
Unscheduled Door Openings per Million
Car Miles
Results Goal
Rule Violations
Unscheduled Door Openings
Unscheduled Door Openings
• 4 Unscheduled Door Openings in FY24 Q2
• 3 due to Passenger Action
• 1 less than previous quarter
Rule Violations
• 5 Rule Violations in FY24 Q2
Safety – Procedure Violations
●
●
●

Page | 30
SAN FRANCISCO BAY AREA RAPID TRANSIT
0.0
1.0
2.0
3.0
4.0
5.0
6.0
FY23 Q1 FY23 Q2 FY23 Q3 FY23 Q4 FY24 Q1 FY24 Q2
Response Time Per Emergency (in
Minutes)
Results Goal
0%
5%
10%
15%
20%
25%
FY23 Q2 FY23 Q3 FY23 Q4 FY24 Q1 FY24 Q2
% Answered Yes
Results Goal
BART Police Response Time
BART Police Presence
Police Presence
• Continued uniformed visibility, daytime and nighttime staffing at
Civic Center
Police Response Time
• Goal met
Security – Police Coverage
Did you see BART Police in the station today?
Did you see BART Police outside
the station today?
Did you see BART Police on this train
?
Data acquired from PES Survey
●
●
●

Page | 31
SAN FRANCISCO BAY AREA RAPID TRANSIT
0.0
1.5
3.0
4.5
6.0
7.5
FY23 Q2 FY23 Q3 FY23 Q4 FY24 Q1 FY24 Q2
Crimes per 1,000
Parking Spaces
Results Goal
Auto Theft
Bike Theft
Auto Burglary
Crime – Theft and Burglary
Bike Theft
Auto Theft
Auto Burglary
• Goal not met
• Goal not met
• Goal met
●
0
1
2
3
4
5
FY23 Q2 FY23 Q3 FY23 Q4 FY24 Q1 FY24 Q2
Crimes per 1,000
Parking Spaces
Results Goal
0
25
50
75
FY23 Q2 FY23 Q3 FY23 Q4 FY24 Q1 FY24 Q2
Total Quarterly Bike
Thefts
Results Goal

Page | 32
SAN FRANCISCO BAY AREA RAPID TRANSIT
0
2
4
6
8
10
12
14
FY23 Q2 FY23 Q3 FY23 Q4 FY24 Q1 FY24 Q2
Crime Per Million Passenger Trip Goal
0
10
20
30
40
50
60
70
80
FY23 Q2 FY23 Q3 FY23 Q4 FY24 Q1 FY24 Q2
Robbery
Electronic Theft
Aggravated Assault
Rape
Homicide
Crime – Against Persons
Crime Against Persons
●
Count of Incidents
Electronic Robbery

Page | 33
SAN FRANCISCO BAY AREA RAPID TRANSIT
BART Watch App
Total BART Watch & Text Counts by Month
Breakdown of 3132 BART Watch Reports
FY23 Q3 FY23 Q4 FY24 Q1 FY24 Q2
723
799
1596
1431
1662
1592
1326
1543
1590
1657
1426
1452
693
658
975
470 470
577
591
579
639
623
520
473
400
600
800
1000
1200
1400
1600
1800
Jan Feb Mar Apr May Jun Jul Aug Sep Oct Nov Dec
BART Watch App Text Messages

Page | 34
SAN FRANCISCO BAY AREA RAPID TRANSIT
Progressive Policing Contacts and Outcomes
Connections to Services by Partner (210)
Summary of Contacts (4522)
• 38 Narcan incidents total; 2 of which were administered by CIS
0
10
20
30
40
50
60
70
80
Color Key
Alameda
Contra Costa
San Francisco
Santa Clara
San Mateo
Other/Multiple

Page | 35
SAN FRANCISCO BAY AREA RAPID TRANSIT
Current PCN’s: 185
Police Hiring Metrics
Police Hiring Pipeline – FY24 Q2
Police Headcount Tracking
*As of 12/31/23
• 50% increase in our monthly BPD sworn officer new
hire rate since the June salary increase
• Hosted three recruitments open houses
- Next one scheduled on February 24
th
(Honoring
African Americans in Law Enforcement)
• 88K views on the “Join BART PD” website since its
launch in July
• 54% increase in applications in July – December
• Increase in number of applicants interviewed
- FY23 Q4: 57
- FY24 Q1: 146
- FY24 Q2: 131
• 3 recruits will graduate from the Academy in February
• 11 recruits currently in the Academy
• 12 will start the Academy in February
13
144 4 14 23
0% 10% 20% 30% 40% 50% 60% 70% 80% 90% 100%
Sworn Officers Field Training In Academy Vacancies

Questions?
